
IJCNC 07
SHAP-GUIDED XGBOOST FOR EXPLAINABLE
NETWORK INTRUSION DETECTION SYSTEM
Areeba Asif Siddiquee1 , Lamia Alhazmi2 and Asif Irshad Khan3
1Department of Computer Science, Aligarh Muslim University, Aligarh, India
2Department of Management Information System, College of Business Administration,
Taif University, P.O. Box 11099, Taif, 21944, Saudi Arabia
3Department of Computer Science, Aligarh Muslim University, Aligarh, India
ABSTRACT
As the internet and networked systems are increasingly growing, cyberattacks have become a more common occurrence. Therefore, the demand for a highly accurate and efficient Intrusion Detection Systems (IDS) has become very important in recent years. Machine learning models have been used to achieve a high rate of accuracy in intrusion detection, but most are “black boxes,” whereby the decisions they make are difficult to understand and explain. This paper introduces an explainable intrusion detection approach that integrates explainable artificial intelligence with a large language model interpretation and machine learning. The NSL-KDD dataset is used to train and test various classification algorithms, such as Random Forest, Support Vector Machine, Logistic Regression, and XGBoost. The model is the best obtained using grid search CV hyperparameter tuning. Our experimental results showed that using classification XGBoost gave the highest outcome of all succession models. SHAP is used to compute feature importance and explain the model’s predictions for better interpretability. In addition, the framework implements a Large Language Model in order to translate SHAP-level feature-based explanations into a text description understandable to security analysts for making sense of detected attacks. The proposed approach helps to enhance the detection performance and also explains the rationale behind the intrusion detection engine of the Network Intrusion Detection System (NIDS), detecting the specific intrusion, thus enhancing the interpretability of the detection results.
KEYWORDS
Intrusion Detection System (IDS), XGBoost, SHAP, Explainable Artificial Intelligence (XAI), Large Language Model (LLM’s)
1.INTRODUCTION
As the advancement in technology and network systems is growing, the need for intelligent security systems that can detect and identify malicious behaviour and take actions accordingly has also become important to maintain the Confidentiality, integrity, and availability [CIA] of data [1]
The purpose of IDS is to detect various types of malicious network traffic or malicious computer use that a firewall cannot recognize [2]. Machine Learning has now become an important tool for detecting these intrusions. These models not only detect pre-defined attacks, but can also easily detect novel attacks as well. These can handle a large amount of traffic and can easily distinguish between normal and malicious attacks accurately. There are many algorithms like Random Forest, Support Vector Machine, Logistic Regression, and XGBoost, which have shown pretty solid results in detecting intrusions. Despite their effectiveness at detecting attacks, many machine learning models are still black boxes, meaning you receive a decision (this has been
marked as “malicious”), but this “something” is not identified. This lack of transparency is the main reason for security analysts’ trust issues. This intrinsic nature of black box models, basically deep learning models, is a fundamental challenge for interpretability [2].
To solve this issue, people have started using Explainable Artificial Intelligence (XAI) methods. In cybersecurity, XAI is particularly essential in enabling transparent risk-informed decisionmaking [3].The best-known XAI method is SHAP (Shapley Additive exPlanations). It breaks things down to show how much each subset of input data influences the final output.
Here’s the catch: XAI tools like SHAP result in lots of numbers and graphs. If you’re a data scientist, the results are easily understandable, but if you’re not, then the results can be pretty confusing.
To tackle this issue, we integrate the results obtained from Shap with Large Language Models [LLM]. LLM’s are the tools that can convert the technical results into simple English language outputs, so that anyone, even with a non-technical background, can easily understand. In this paper, we’re rolling out an explainable AI system that integrates machine learning, XAI, and large language models. We test many machine learning algorithms on the NSL-KDD dataset, use GridSearchCV to pick the best one, and then use SHAP to explain its results. The real difference? A Large Language Model takes those SHAP results and translates them into straightforward explanations, making the whole system easy to understand for all. The goal here isn’t just to detect the threats with high accuracy but also to make the model’s reasoning crystal clear so analysts can respond smarter and faster to any network attack.
2. RELATED WORK
Ali et al. investigated some of the problems of IDS in a network, which include class imbalance. To tackle this, the researchers used several machine learning algorithms like Random Forest (RF), Naive Bayes (NB), Logistic Regression(LR), KNN, and Decision Tree(DT), along with several deep learning models like Multi-Layer Perceptron (MLP), Convolutional Neural Network (CNN), and Long-Short Term Memory (LSTM). They used these algorithms on a benchmark dataset, CICIDS2017. Random Forest got the best accuracy score (99.9\%) among all the models, even better than the deep learning models. The results proved that random forest can be very good and effective in detecting intrusions in large-scale networks [4].
Loi et al. studied the challenges faced by cybersecurity analysts when they detect an attack. The challenge faced is the Explainability of the model. He introduced an effective Explainable AI detection system for Industrial Internet of Things (IIoT) Networks. He used a Random Forest classifier for detecting attacks and then explained the results obtained by SHAP( Shapley Additive Explanations) methods. The results showed high accuracy, and the results of the explainability helped the security analysts understand why something was flagged as malicious. The dataset used was CIC IoT-DIAD 2024 [5].
Alam et al. introduced a method named SXAD ( Shapely Explainable Anomaly Detection) to deal with the lack of transparency in LAD systems (Log Anomaly Detection). Addressing this lack of transparency, this framework integrated Explainable AI with machine learning models such as Decision Tree, Random Forest, and Gradient Boosting using the SHAP Technique. The dataset used was the Hadoop Distributed File System (HDFS) log dataset. The results showed high detection accuracy, reaching 99.99%, 99.85%, and 99.99%, while also providing explanations for the events that were responsible for the anomalous behaviour [6].
The article XRGuard: A Model-Agnostic Approach to Ransomware Detection with Dynamic Analysis and Explainable AI is dedicated to the issue of identifying modern ransomware, which tends to overcome the traditional signature-based security systems. The authors present their machine learning-driven framework, named XRGuard, in this work, which is used to analyze Event Tracing for Windows (ETW) logs in order to identify suspicious file input/output activity. Explainability methods of SHAP and LIME are also used in the system to make the decisions of the model easier to understand. The results show that the proposed model achieves a 99.69% detection rate at a 0.5 % false positive rate, and can provide interpretable descriptions of the predictions of the model at the same time, which suggests that the framework can be used to detect ransomware accurately and provide an interpretable description of the predictions of the model [7].
Another recent study, TBAC-IDS: Enhancing Intrusion Detection with Transformer-Based Alerts Correlation, looks at a limitation of traditional intrusion detection systems. Most of the current IDS approaches view alerts individually and overlook the correlation between the alerts, which is usually the cause of a large number of false positives. To solve this, the authors suggest a Transformer-based encoder attention model that correlates and prioritizes alerts by taking into account their contextual relationships. This method used the SABU intrusion alert dataset. The results of the experiment indicate that the model has a 99.34% classification accuracy and a 0.55% error rate, which implies that the model detects better and has fewer false positives than traditional methods [8]
Alasmari et al. (2025) concentrate on the high growth of phishing attacks, which have risen approximately 350% since 2020, particularly in the Industrial IoT setting. To deal with this, the authors propose a hybrid approach that combines a CNN-LSTM model for analyzing URLs with DistilBERT for processing text and email content. Explainable AI techniques [9] and LLM-based explanations also support the system to allow the predictions of the model to be easier to understand. The framework was experimented with mixed samples of 21,000 web URLs and 1.6 million text and email samples. Findings indicate up to 93-99% accuracy, with another 41% lower than baseline algorithms to minimize false positives in phishing detection in IoT 2025 scenarios [10].
Zhang and Liu (2026) investigate the challenge in AI systems to work with complex legal documents, particularly in an attempt to forecast court violations or determine which articles of the law have been violated. To solve this, they created LexFaith-HierBERT, a BERT model that is used to process long legal cases in smaller portions. The model also relies on attention mechanisms to focus on significant pieces of evidence and has explanation tools like LIME and SHAP to make sense of the predictions. This method was experimented on the cases of the European Court of Human Rights (ECtHR), where over 11,000 samples of the LexGLUE benchmark dataset were used. The findings indicate 88% violation detection accuracy and an F1- score of 71% for detecting the correct legal articles [11].
Belcastro et al. (2026) discuss the issue that most cybersecurity tools fail to identify more insidious attacks like DDoS or ARP poisoning, and commonly do not offer an easy-to-understand report to the analyst. To enhance this, the authors propose KLAGE, a system that transforms network logs into Knowledge Graphs. Graph-BERT is then used to analyze these graphs and identify suspicious activity. To be interpretable, the system relies on LIME to interpret the predictions and LLMs to produce more readable reports that are easier to comprehend by analysts. This framework, tested on IoT attack data, was found to be approximately 84% accurate, which is approximately 5% better than other solutions, and generated easier-tounderstand reports, which experts found easier to interpret compared to other methods [12].
Ajayan et al. (2026) was interested in identifying Distributed Denial of Service (DDoS) in real time and this may not be easy to detect by many lightweight intrusion detection systems. The authors use DistilBERT, a smaller and faster version of BERT, and convert network traffic data to a text format to feed into the DistilBERT model. They also deal with class imbalance with SMOTE and class weighting, and also with SHAP and LIME to interpret the predictions of the model. The system was evaluated on various datasets such as CIC-IDS2017, CIC-DDoS2019, and UNSW-NB15, as well as on real-time performance. The findings demonstrate a high accuracy of more than 99\%, low false positives, and rapid inference time ranging between 7-20 milliseconds, which means that the method is feasible when used in real-life applications [13].
3. METHODOLOGY
NIDS monitors and analyzes all traffic flows over its entire network region in real time [14]. The suggested NIDS is an integration of machine learning, explainable artificial intelligence [15], and natural language generation to produce an accurate and interpretable system. The primary objective is not only accurate detection of network intrusions, but also a good explanation of the prediction. This aids in making the system more transparent and useful to the security analysts.
The framework is a multi-stage process. It starts with the preparation of datasets, and then machine learning models are trained. Hyperparameter tuning is used to determine the optimal model to ensure the best performance. Once the model is trained, explainability methods can be applied to determine the most important features that play a role in each prediction. Lastly, these insights are transformed into human-readable explanations with the help of language models, which will enable users to gain a better understanding of the nature of detected attacks.
3.1. Dataset Preparation
The NSL-KDD dataset is employed in the given study, which is a popular dataset in research on intrusion detection. The data set is represented by each record being a network connection, and each network connection is described by a set of 41 different features. These characteristics give details on how the network traffic is behaving, how long the connection is taking, the protocol being used, the amount of data being transferred, and many other aspects of the session. With these properties, each record also contains a label that indicates the state of the connection being normal or a part of an attack. The attacks found in the dataset are Denial of Service (DoS), Probe, Remote-to-Local (R2L), and User-to-Root (U2R) attacks
The dataset should be preprocessed before the implementation of machine learning models. The attributes in the data are numerical values, so the data should therefore be transformed into a numerical format to allow the machine learning algorithms to work with the data and learn the patterns in the data accordingly.
3.2. Data Preprocessing
Prior to training the machine learning models, some pre-processing steps are taken to ensure that the dataset is appropriate for learning. Another challenge that is common in real-world data sets is class imbalance, in which one or more classes have much fewer samples compared to the other classes. Imbalanced data implies that the observations in one class are significantly less than in the rest, and it could influence the performance of the model to learn and predict the classes [1]. A number of categorical features can also be found in the dataset, including protocol type and service type. Most machine learning algorithms cannot make use of these types of features directly. To deal with this, they are converted into numerical form using methods like label
encoding and one-hot encoding [14]. Once this is done, all the features are in a format that can be processed by the models. The data is then divided into input features and their labels, indicating whether the traffic is normal or a particular type of attack.
The other step is to deal with missing or undefined values. In most real data, not all the values are present, and when they are not handled, they can influence the performance of the model. These values are recognized and substituted with the basic statistical methods of mean, median, or mode. Duplicates are also eliminated to ensure that the model is not taught the same pattern many times, and this may cause overfitting. In order to ensure that every feature has an equal contribution in the training process, feature scaling is used. There can be features with a lot greater values than others, and this can affect the learning process. Normalization and standardization methods are employed in a way that the values of various features have a similar range. Not every feature is useful for prediction. Others can have very little information or can resemble other features to a high degree. Retaining such features will not add value to performance but complexity. Thus, characteristics with extremely low variance or with high correlation with others are dropped, which simplifies the model and saves on superfluous computation.
Finally, to tackle the problem of class imbalance, a Synthetic Minority Over-sampling Technique (SMOTE) [15] is applied. In this technique, the minority classes are generated by making new synthetic samples by interpolating between existing data samples. People can use SMOTE to teach the model about the patterns of the minority classes and its ability to identify less frequent attacks is enhanced due to the additional number of samples provided by SMOTE [4].
3.3. Machine Learning Model Training
ML and DL methods have rendered intrusion detection systems far more efficient than the conventional rule-based methods. These approaches do not use a set of predefined rules but are able to analyze massive quantities of network data, identify intricate patterns, and evolve to new forms of attacks, as time progresses. Nonetheless, one of the greatest weaknesses of these models is that they tend to be hard to interpret, although they perform well. Most sophisticated algorithms can be described as black boxes, i.e., not always it is evident how it gets to a given decision [5].
Various machine learning models have been discussed in this work to find out the most appropriate machine learning model that can be used in intrusion detection. Random Forest, Support Vector machine, Logistic Regression, and XGBoost are some of the models that are trained and compared. Extra work is done to enhance their performance with hyperparameter tuning as opposed to default configurations.
To this end, we use GridSearchCV, which sequentially tries various combinations of parameters and assesses them with cross-validation. This aids in identifying the best settings of every model. In accordance with this process, the best overall performing model is chosen as the ultimate classifier in network intrusion detection.
3.3.1. Random Forest
Random Forest is an ensemble learning algorithm that works by creating many decision trees during training. Instead of training all trees on the exact same data, it uses a bagging approach, where each tree is trained on a different bootstrap sample taken from the original dataset [6]. The final prediction is determined using majority voting:

where hᵢ(x) represents the prediction of the i-th decision tree. Random Forest improves accuracy and reduces overfitting by averaging multiple models.
3.3.2. Support Vector Machine
Support Vector Machine is a supervised learning technique that optimally classifies classes by determining the best separating hyperplane. The boundary of the decision region is given as:

where w is the weight vector, x is the input feature vector, and b is the bias. SVM attempts to maximize the margin between classes to improve classification performance.
3.3.3. Logistic Regression
Logistic Regression is a classification technique based on the logistic function that represents the probability of a class.

Logistic Regression transforms linear predictions into probabilities between 0 and 1
3.3.4. XGBoost
XGBoost is a gradient boosting algorithm, which sequentially constructs trees for each step and tries to fix errors made by the previous trees. The goal function of XGBoost is:

where L is the loss function, Ω represents the regularization term, and K represents each decision tree. This regularization improves generalization and prevents overfitting.
3.4. Hyperparameter Optimization
Machine learning models are not solely based on the training data. They also use some parameters to control the learning process and are referred to as hyperparameters. The values of these parameters have the potential to have a significant impact on model performance. In treebased models, for instance, the number of trees, the maximum depth of trees, and the learning rate may impact the capacity of the model to learn the pattern in the data
This study does not select these values by hand, but employs GridSearchCV to find a good combination of hyperparameters. In this technique, a number of sets of parameter values are tested. Each set is trained and tested on the model and evaluated for its performance. In this way, a model can be optimized for higher accuracy by playing with several combinations of parameters, without going through the process of manual experimentation and trial and error. This aids in generating more consistent and apt results, fitting the intrusion detection task.
3.5. Model Evaluation
To evaluate the performance of the intrusion detection models, several classification metrics are used. These metrics are calculated using the confusion matrix consisting of True Positive (TP), True Negative (TN), False Positive (FP), and False Negative (FN)
3.5.1. Accuracy: Accuracy measures the proportion of correctly classified samples:

3.5.2. Precision: Precision measures how many predicted attack instances are actual attacks:

3.5.3. Recall: Recall measures how many actual attack instances were correctly detected:

3.5.4. F1 Score: F1 Score combines precision and recall into a single metric:

3.6. Explainability using SHAP
As much as machine learning and deep learning methods are effective in intrusion detection, they may not be applicable in high-security environments due to their uninterpretability. Most of the models act as black boxes and it is hard to comprehend how they arrive at the predictions [7].
Although very accurate, this lack of transparency decreases trust in their decisions. To address this issue, the proposed framework uses SHAP (Shapley Additive exPlanations) as an explainability method. SHAP is founded on Shapley values of cooperative game theory, in which the contribution of each individual to the final result is fairly calculated. In this context:
a) The model prediction is considered the ultimate result.
b) Each feature is considered a contributor.
c) SHAP estimates the value of each feature to the prediction.
SHAP also offers feature importance plots, showing the impact of each feature on the predictions of the model [6]. This enhances the decision of the model and makes them more understandable. SHAP Mathematical Formulation:
The Shapley value for a feature i is defined as:

Explanation in simple terms:
F = set of all features excluding feature i
S = subset of features
f(S) = model prediction using features in subset S
The formula calculates:
How the prediction changes when feature i is added to different feature subsets.
Then it averages these contributions across all possible feature subsets.
This gives a fair contribution value for each feature.
3.7. Natural Language Explanation Using LLM
Humans are not always effective at detecting misleading or generated texts, and studies indicate that personal biases may also affect the perception of such texts as well [16]. In a similar way, although SHAP gives numerical explanations about model decisions, these values can be difficult for people without a technical background to understand.
To simplify these explanations, the framework is based on a Large Language Model (LLM) that converts the technical outputs into more human-friendly descriptions. The values of SHAP feature importance are transferred to the LLM through structured prompts, and the model, in turn, produces an explanation of why a certain network instance was classified as malicious or benign. Since LLMs are capable of comprehending language and context well, understanding their output, and generating more understandable explanations that are easy to read and interpret by humans, they assist in transforming complex model outputs into understandable ones
4.EXPERIMENTAL SETUP
4.1. Dataset Description
NSL-KDD data is also a popular benchmark dataset in cybersecurity studies, where intrusion detection is studied using the NSL-KDD dataset as a benchmark dataset in the literature [17]. It is a more sophisticated version of the previous KDD Cup 99 dataset [18], which was adapted in such a way that made the results of the experiments more consistent and reliable.
4.2. Experimental Environment
The experiments are carried out using the Python programming language, mainly because it provides many useful libraries for machine learning and data analysis. The implementation is done in the Google Colab environment, which allows models to be trained using cloud-based computing resources without requiring high-end local hardware.
The system used for the experiments includes an Intel processor along with cloud GPU support, which helps speed up the training and evaluation of the machine learning models. Several software libraries are used during the implementation process, such as Scikit-learn for implementing machine learning algorithms and evaluating model performance, Pandas for handling and preprocessing the dataset, NumPy for performing numerical operations, Matplotlib and Seaborn for visualizing the experimental results, SHAP for generating explainability analysis, and Transformers torch for LLMs. These libraries help with different parts of the workflow, including preparing the data, training the models, and generating explanations for the intrusion detection results
4.3. Data Splitting
In this study, the dataset is usually split using an 80:20 ratio, where80% of the data is used to train the model and 20% of the data is kept for testing and evaluation. Using this type of split helps in evaluating the model more fairly, since the final results are measured on data that was not included during the training stage.
4.4. Feature Reduction Experiment
To better see how individual features influence the model, an additional experiment was carried out using feature reduction. The idea was to observe how the model behaves when it is trained with only the most important features instead of using the full feature set.
First, feature importance scores were calculated using SHAP. These scores indicate how much each feature contributes to the model’s predictions. Based on the SHAP values, the features were arranged from the most important to the least important. After ranking the features, smaller subsets of the top features were selected. The XGBoost model was then trained again using only these selected features. Three different cases based on Top 3 features, Top 5 features, and Top 10 features were tested. For each case, the model was trained and tested under the same conditions as the main experiment. The performance was evaluated using accuracy. The goal was to see whether a smaller set of important features could still give results close to those obtained when all features are used.
This experiment helps in identifying how many features are actually needed to maintain good performance, while also making the model simpler and more efficient
4.5. Natural Language Explanation
A transformer-based language model, DistilGPT-2, was used through the Hugging Face Transformers library in PyTorch to generate simple explanations from the SHAP results.
The model receives the most important features along with their corresponding SHAP values as input and converts this information into natural language explanations. These explanations describe how the different features influence the final prediction made by the model. It should be noted that the transformer model is used only to produce explanations and is not involved in the classification process itself.
5.RESULTS AND DISCUSSIONS
The results of the proposed intrusion detection framework are presented in this section. Different machine learning models were tested to see how well they can detect malicious network traffic. They were assessed on typical performance indicators like accuracy, precision, recall, and F1- Score
In addition, SHAP was used to understand which features had the most impact on the model’s predictions. Finally, a Large Language Model was used to convert these technical results into simple, human-readable explanations.
5.1. Results Analysis
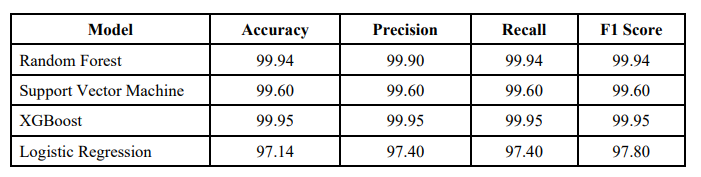
The results,as shown in table 1, shows that the ensemble-based model XGBoost achieved the best classification performance in the evaluated models. This model had an accuracy of 99.95%, which was better than other algorithms like Random Forest and Support Vector Machine.
The advantage of XGBoost is that it does so by using the gradient boosting technique, which gradually fine-tunes the model’s prediction by adjusting the outcomes produced by the previous trees.
Table 1. EModel Performance Comparison.

5.2. Confusion matrix
The confusion matrix is then obtained for the best performing model i.e. XGBoost as shown in table 2.
Table 2. Confusion matrix for the XGBoost model.
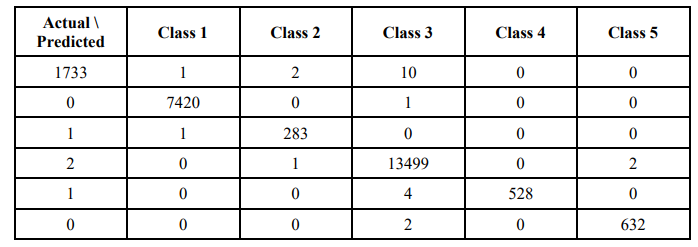

The selection model is XGBoost, and the confusion matrix provides the visualization of the model classification of the network traffic instances, with most of them being correctly classified. The model is able to detect attack cases with a high number of true positives, while the number of false positives for normal traffic remains low. This means the Model is effective in separating normal and malicious network activity.
5.3. SHAP Analysis Results
To better understand how the model makes its predictions, feature importance analysis was carried out using SHAP. The SHAP summary plot helps show which features have the strongest influence on the model’s decisions. In this plot, features are arranged based on their overall impact on the predictions, allowing us to see which variables the model relies on the most. From this analysis, features such as src_bytes, dst_host_same_srv_port_rate, and count were observed to play a major role in the classification results. These features have a stronger effect on whether a network instance is predicted as normal traffic or an attack.
The numerical ranking of feature importance from the SHAP analysis is shown in Table 3.This table gives a more detailed picture by giving the importance value to each feature according to its contribution to the model predictions. Of all the features, src bytes has the largest value, 1.41963. This implies that the amount of data sent fromthe source is important to differentiate between regular and malicious network activity.
The ranking of features,as shown in Table 3,helps quantify their contribution to the XGBoost model’s predictions. By examining these values, it becomes easier to understand which network characteristics are most important for detecting attacks and how strongly each feature affects the final classification decision.
Table 3. SHAP Feature Importance Ranking..
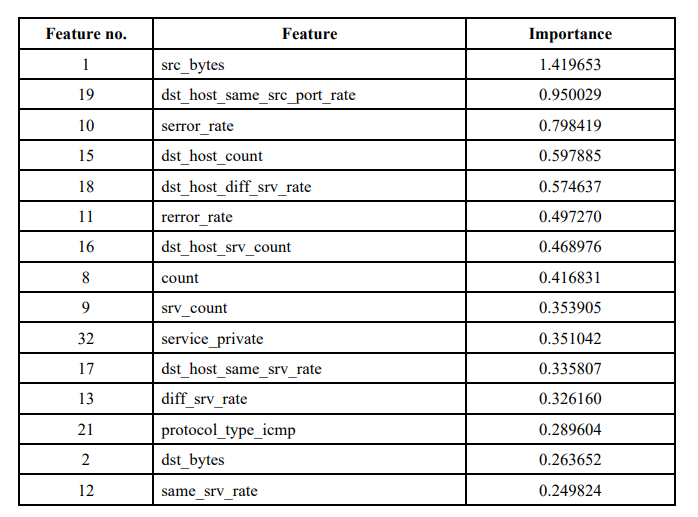

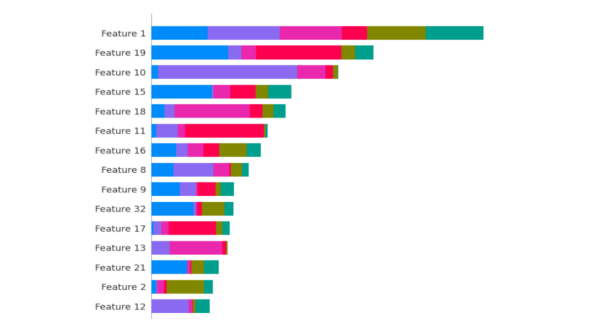

Figure 1. SHAP Summary Plot
The same top features are represented in Figure 1 in the form of a horizontal. At the end of the day, the network traffic dominates, and it’s very evident in the bar plot. The volume features (src_bytes, dst_host, same src_port rate) over. Features include protocol and error rate. The visual
5.4. Feature Reduction Results
The results of the feature reduction experiment are presented in Table 4. The table shows the classification accuracy achieved when the intrusion detection model was trained using different numbers of top-ranked features
Table 4 . Model Accuracy vs Number of Features Used
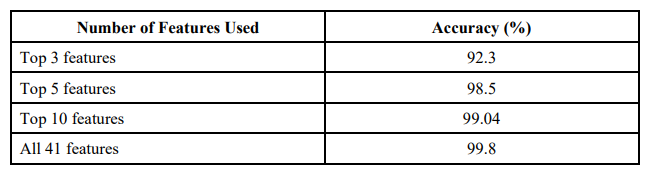

The results indicate that accuracy increases with the number of features in the model: The model was able to obtain an accuracy of around 92.3% when only the top 3 features were used. There was a slight improvement in the accuracy at five features, which was approximately 98.5%. One of the major findings of the experiment was that the top 10 most important features gave about 99.04% accuracy in classification. This means that a small proportion of features represents a much larger proportion of the information necessary for an effective ID system.
Although the full feature set of 41 attributes provides the highest accuracy, the improvement beyond the top ten features is comparatively smaller. This suggests that the remaining 31 features contribute less significantly to the predictive capability of the model.
To further illustrate this relationship, a performance graph was generated showing the change in model accuracy as the number of selected features increases.
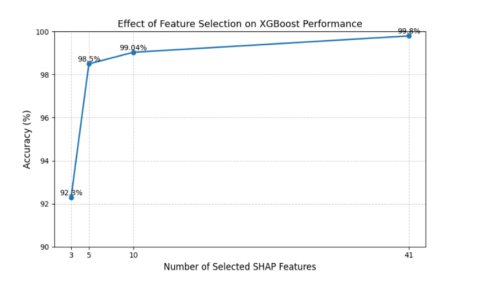

Figure 2 . Effect of Feature Selection on XGBoost Performance
Figure 2 demonstrates that accuracy increases rapidly when the most important features are added, while the performance gain gradually stabilizes as additional, less-informative features are included.
The results have shown that feature importance analysis is a proper approach to select the most important features for the network intrusion detection system. Moreover, the most influential features acquired from this analysis are used as input in the generation of natural language explanations with the help of a Large Language Model.
5.5. Attack specific feature Importance Analysis
To better understand the model in identifying various types of attacks, an analysis of attack specific features was conducted using SHAP. Although overall feature importance can reveal what features are significant in the entire dataset, this step examines which features are most significant in each category of attack. Such analysis can be useful to enhance detection and interpretability, which is particularly critical in security systems where black-box predictions are potentially dangerous to rely on alone [19].
To do this, SHAP values were estimated on all predictions made by the XGBoost model. These values show the contribution of each feature in the prediction as compared to a baseline value. It is simpler to cluster these SHAP values based on each type of attack in order to determine which features are prominent in distinguishing between different types of attacks.
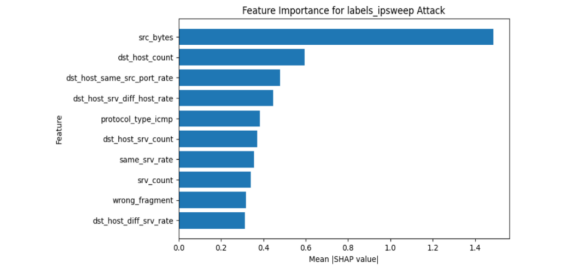

Figure 3 . Feature importance plot for labels ipsweep (Probe) Attack
Figure 3 describes that the src_bytes feature is the most prominent feature in the SHAP featureimportance plot in detecting an Ipsweep (Probe) attack type in comparison to all other features. Other salient features like dst_host_count, dst_host_same_src_port_rate, and protocol_type_icmp are important in picking up probing behavior in the network traffic.
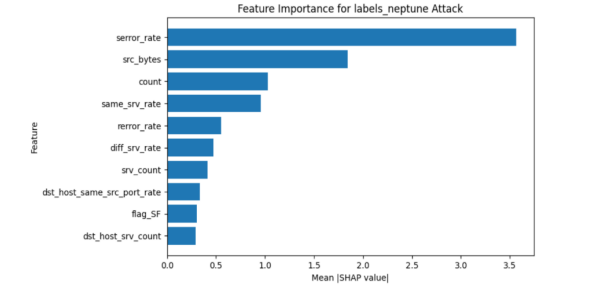

Figure 4 . Feature importance plot for labels neptune (DoS) Attack
Figure 4 describes that the Neptune (DoS) attack’s feature importance plot shows that the count, src_bytes, and serror_rate features are the most valuable features for this attack. These features are meant to point to the unusual connect error patterns and intensive traffic flow witnessed during DDoS
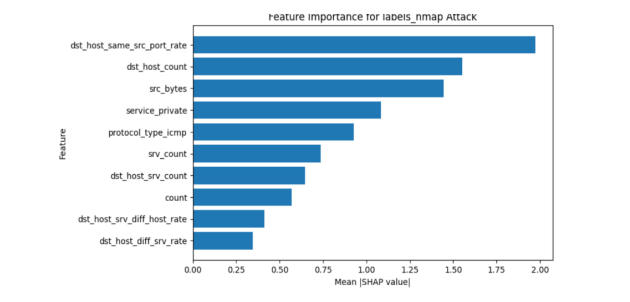

Figure 5 . Feature importance plot for labels nmap (Probe) Attack
Figure 5 describes that the attribute (feature) importance plot for attack type Nmap (Probe) can be seen that the most important feature for the identification of the attack is dst_host_same_src_port_rate and dst_host_count. It is also important in detecting probing attempts to examine features relating to host scanning behavior and to ICMP protocol activity.
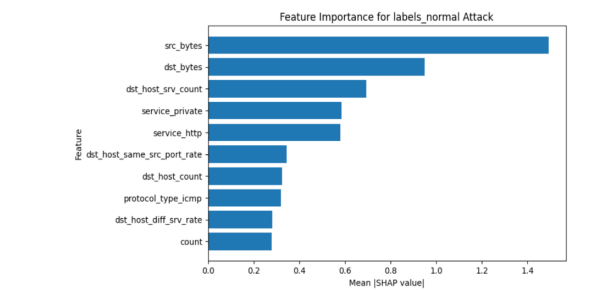

Figure 6 . Feature importance plot for labels normal (Normal) Attack
Figure 6 describes that the Normal traffic is the most important feature differentiating normal network behavior, which includessrc_bytes and dst_bytes, according to the SHAP analysis. There are also service-related features, like service_private or service_http, that can further describe a legitimate traffic pattern
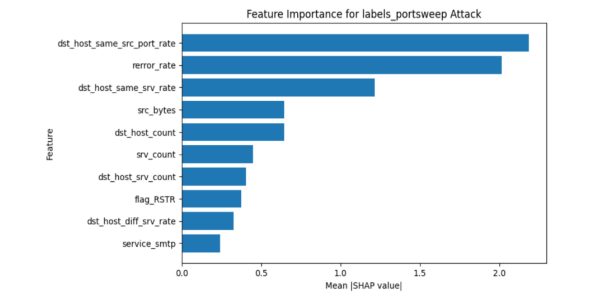

Figure 7 . Feature importance plot for labels portsweep (Probe) Attack
Figure 7 describes that the feature importance plot for Portsweep (Probe) attack shows that two features, dst_host_same_src_port_rate and rerror_rate, have the highest impact on the classification. These are features observed when probing attacks are repeated due to connection failures and/or port scans.
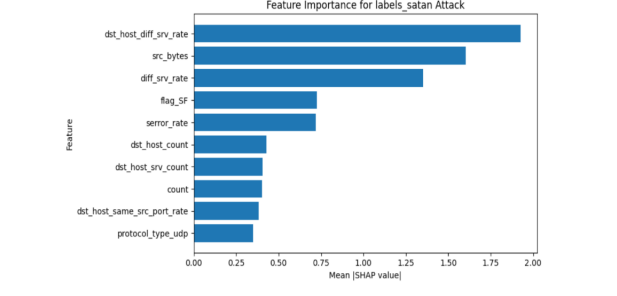

Figure 8 . Feature importance plot for labels satan (Probe) Attack
Figure 8 reveals that the most important attributes in differentiating a satan probe attack are dst_host_diff_srv_rate, src_bytes, and diff_srv_rate, which clearly represent the variation of the services provided by the host and the volume of the traffic.
The outcome of this analysis reveals that there are different sets of important features associated with different attack types. For instance, some traffic-related parameters like connection count, servicetype, and so forth, can have a more significant effect when determining denial of service; denial of service occurs when a large number of packets are being sent in a brief time. However, host-based features can be more important for detecting probing and/or scanning traffic in which a hacker tries to find out a bit more about the system using a series of small requests to multiple services or ports.Based on these observations, one can see that unique featurepatterns are not used for each attack category in the intrusion detection model. Rather, the model is trained with different associations between features and attack behaviors, depending on the type of network traffic being analyzed.The model can recognize various patterns, which are used to detect various types of malicious actions in a different way, as opposed to all at once.
To make these patterns easier to examine, SHAP feature importance graphs were generated separately for each attack category. These graphs display the features that contribute the most to detecting a specific attack type and also show how strongly each feature influences the model’s prediction. By studying these visualizations, it becomes easier to understand how the model differentiates between different forms of malicious network behavior and which network characteristics are most relevant for each type of attack
The analysis also indicates that, for most attack types, only a small subset of features tends to dominate the prediction process. In other words, the model mainly depends on a limited number of highly informative features rather than using all available features equally. Identifying these attack-specific features is useful for improving interpretability and for gaining deeper insight into how different network intrusions behave. It can also help reduce model complexity in future implementations by focusing on the most relevant attributes.
The most influential features identified in this step are later used as input to a Large Language Model, which converts the technical SHAP outputs into simple natural language explanations. These explanations describe why a particular network traffic instance was classified as a specific attack type and which features contributed most to that decision.
By linking each attack category with the features that influence it the most, this approach provides a clearer view of how the intrusion detection system reaches its decisions. As a result, it not only improves the transparency of the proposed framework but also makes the model’s behavior easier to understand for researchers and security analysts
5.6. LLM Explanation
To enhance the interpretability of the intrusion detection framework, a Large Language Model was employed to generate natural language explanations for the model predictions. The explanation generation was implemented using the pipeline interface of Transformers (Hugging Face) with the deep learning backend PyTorch.
For each prediction produced by the classifier based on XGBoost, the most influential features were identified using SHAP. The top contributing features associated with the predicted attack category were incorporated into a structured prompt and provided as input to the language model.Based on the prompt, the LLM generated concise textual explanations describing the potential reasons behind the classification decision. These explanations summarize the relationship between the observed network traffic characteristics and the predicted attack type.
To make the system more reliable, a fallback method is used with a try–catch block. If the transformer model fails to generate an explanation, the system uses a predefined rule-based approach instead. These rules are created by studying different types of attacks and the features that affect them. This ensures that the system can still provide explanations even if the model does not work properly.
Table 5 . Top SHAP Features with LLM-Readable Explanations for Each Attack Type.
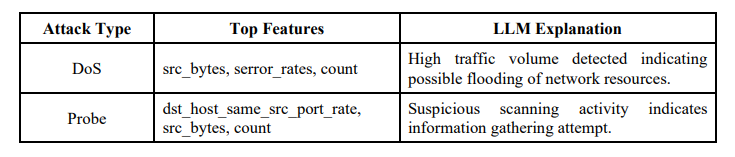

The resulting explanations benefit users with an interpretable description of the model predictions through the translation of feature-level importance into natural language. Such a combination of explainability techniques and a Large Language Model enhances the visibility of the intrusion detection system and helps analysts to comprehend the logic behind network attacks identified as shown in Table 5.
5.7. Discussions
The findings indicate that the intrusion detection framework proposed is effective in detecting malicious traffic on the network. Ensemble learning models such as Random Forest and XGBoost also assist in enhanced performance by summing up the abilities of various models within them [20].XGBoost performed the best out of all the models tried, and this proves that the ensemble methods are highly effective in detecting intrusions [21]. The fact that the model has a high accuracy on the NSL-KDD data also indicates that it is able to distinctively tell between normal and attack traffic.
Explainable AI is significant in simplifying model decisions. Such techniques assist in the presentation of results in an understandable and interpretable manner [22].SHAP was applied in this work to comprehend the way the model arrives at its decisions. The results showed that only a few features have a major impact on the predictions. It was also observed that different types of attacks depend on different important features, which reflects the unique behavior of each attack. The experiment on feature reduction demonstrated that we do not require all features to achieve a good performance. One could still achieve approximately 95 percent of the original accuracy with just the 10 most important features. This implies that there are numerous features that can affect the final outcome minimally.Lastly, the technical SHAP outputs were translated into simple, understandable explanations with a Large Language Model. This will enable cybersecurity analysts to know the reason behind a specific prediction. In general, the comprehensive package of properly modeled and explainable analysis with the use of clear language-based explanations renders the suggested intrusion detection system more transparent and comprehensible.
6.CONCLUSION AND FUTURE WORK
6.1. Conclusion
This paper demonstrated a framework of intrusion detection that can be interpreted and that applies machine learning, explainability methods, and natural language explanation generation. Tests on the NSL-KDD dataset revealed that the ensemble model XGBoost is able to produce high detection accuracy when detecting malicious network traffic.
In order to add more transparency, SHAP was used to understand the importance of features in the model prediction; the most important features (the highest SHAP values) are the most influential features affecting the prediction of the model. The experiment on feature reduction also showed that only a few important features can be used to preserve a significant amount of predictive accuracy of the model, suggesting that very few features have an overbearing influence in intrusion detection. Further, attack specific feature analysis helped gain an understanding of the specific feature pattern of various types of network attacks.
To improve interpretability for human analysts, a Large Language Model was integrated using the pipeline interface of Transformers (Hugging Face) with PyTorch. The language model generated concise explanations based on the most influential features, enabling the translation of model decisions into understandable natural language descriptions. A fallback rule-based mechanism ensures explanation generation even when the language model fails.
6.2. Future Work
Future research will look at how to extrapolate the explainability analysis to deep learning architectures, such as intrusion detection transformers. In addition, the use of real-time LLM services such as OpenAI APIs or locally deployed models through Ollama will be explored to improve explanation quality and enable real-time interpretability in practical cybersecurity environments.
7.DATASET AVAILABILITY
The data that support the findings of this study are available in the NSL-KDD dataset at https://www.kaggle.com/datasets/hassan06/nslkdd. The data were collected from public domain resources available in the public domain: NSL-KDD dataset [18].
8.CONFLICT OF INTEREST
The authors declare no conflict of interest.
REFERENCES
[1] Kelvin J. Mwiga et al. “A Generative AI Method for Minority Class Handling in Anomaly Detection with Drift and Explainability Analysis”. In: New Generation Computing 44.2 (May 2026), p. 13. ISSN: 0288-3635, 1882-7055. DOI: 10.1007/s00354-026-00318-8. URL: https://link.springer.com/10.1007/s00354-026-00318-8 (visited on 03/17/2026).
[2] AsfAbderezakTouzene, Ahmed Al Farsi, and Nasser Al Zeidi. “High Performance NMF Based Intrusion Detection System for Big Data IoT Traffic”. In: International journal of Computer Networks & Communications 16.2 (Mar. 29, 2024), pp. 43–58. ISSN: 09752293. DOI: 10.5121/ijcnc.2024.16203. URL: https://aircconline.com/ijcnc/V16N2/16224cnc03.pdf (visited on 05/22/2026).
[3] HuadingSu et al. “Source Code Vulnerability Detection Based on Deep Learning: A Review”. In: Cybersecurity 9.1 (Jan. 4, 2026), p. 2. ISSN: 2523-3246. DOI: 10.1186/s42400-025-00518-7. URL: https://link.springer.com/10.1186/s42400-025-00518-7 (visited on 03/17/2026).
[4] Spyridon Papastergiou et al. “Explainable AI-Based Dynamic Cybersecurity Risk Management for Cyber Insurability”. In: International Journal of Information Security 25.1 (Feb. 2026), p. 36. ISSN: 1615-5262, 1615-5270. DOI: 10.1007/s10207-025-01189-8. URL: https://link.springer.com/10.1007/s10207-025-01189-8 (visited on 03/17/2026).
[5] Md Liakat Ali et al. “Deep Learning vs. Machine Learning for Intrusion Detection in Computer Networks: A Comparative Study”. In: Applied Sciences 15.4 (Feb. 12, 2025), p. 1903. ISSN: 2076- 3417. DOI: 10.3390/app15041903. URL: https://www.mdpi.com/2076-3417/15/4/1903 (visited on 03/19/2026).
[6] PierangeloLoi et al. “SHAP Happens: An Explainable IDS for Industrial IoT Networks”. In: 2025 IEEE 9th Forum on Research and Technologies for Society and Industry (RTSI). 2025 IEEE 9th Forum on Research and Technologies for Society and Industry (RTSI). Tunis, Tunisia: IEEE, Aug. 24, 2025, pp. 71–76. ISBN: 979-8-3315-9788-7. DOI: 10.1109/RTSI64020.2025.11212598. URL: https://ieeexplore.ieee.org/document/11212598/ (visited on 03/17/2026).
[7] Kashif Alam et al. “SXAD: Shapely eXplainable AI-Based Anomaly Detection Using Log Data”. In: IEEE Access 12 (2024), pp. 95659–95672. ISSN: 2169-3536. DOI: 10.1109/ACCESS.2024.3425472. URL: https://ieeexplore.ieee.org/document/10589622/ (visited on 03/17/2026).
[8] M. Adnan Alvi and Zunera Jalil. “XRGuard: A Model-Agnostic Approach to Ransomware Detection Using Dynamic Analysis and Explainable AI”. In: IEEE Access 13 (2025), pp. 53159–53170. ISSN: 2169-3536. DOI: 10.1109/ACCESS.2025.3553562. URL: https://ieeexplore.ieee.org/document/10937028/ (visited on 03/17/2026).
[9] Abdelkader Bouguessa et al. “TBAC-IDS: Enhancing Intrusion Detection with Transformer-Based Alerts Correlation”. In: Cluster Computing 28.16 (Dec. 2025), p. 1012. ISSN: 1386-7857, 1573-7543. DOI: 10.1007/s10586-025-05716-z. URL: https://link.springer.com/10.1007/s10586-025-05716-z (visited on 03/17/2026).
[10] Gazi Mohammad Imdadul Alam et al. “Real-Time Detection of Forest Fires Using FireNet-CNN and Explainable AI Techniques”. In: IEEE Access 13 (2025), pp. 51150–51181. ISSN: 2169-3536. DOI: 10.1109/ACCESS.2025.3552352. URL: https://ieeexplore.ieee.org/document/10930496/ (visited on 03/17/2026).
[11] Sara Mohammed Alasmari et al. “Phishing Detection in IoT: An Integrated CNN-LSTM Framework with Explainable AI and LLM-enhanced Analysis”. In: Discover Internet of Things 5.1 (Sept. 30, 2025), p. 102. ISSN: 2730-7239. DOI: 10.1007/s43926-025-00202-9. URL: https://link.springer.com/10.1007/s43926-025-00202-9 (visited on 03/17/2026).
[12] Xiaoyue Zhang and Shuang Liu. “Explainable Judgment Prediction and Article-Violation Analysis Using Deep LexFaith Hierarchical BERT Model”. In: Scientific Reports 16.1 (Jan. 3, 2026), p. 2974. ISSN: 2045-2322. DOI: 10.1038/s41598-025-32833-x. URL: https://www.nature.com/articles/s41598-025-32833-x (visited on 03/17/2026).
[13] Loris Belcastro et al. “Enhancing Network Security Using Knowledge Graphs and Large Language Models for Explainable Threat Detection”. In: Future Generation Computer Systems 176 (Mar. 2026), p. 108160. ISSN: 0167739X. DOI: 10.1016/j.future.2025.108160. URL: https://linkinghub.elsevier.com/retrieve/pii/S0167739X25004546 (visited on 03/17/2026).
[14] Tuan Nguyen Kim et al. “A COMBINATION OF THE INTRUSION DETECTION SYSTEM AND THE OPEN-SOURCE FIREWALL USING PYTHON LANGUAGE”. In: International journal of Computer Networks & Communication 14.1 (Jan. 31, 2022), pp. 5969. ISSN: 09752293. DOI: 10.5121/ijcnc.2022.14104. URL: https://aircconline.com/ijcnc/V14N1/14122cnc04.pdf (visited on 05/21/2026).
[15] Amal Ajayan, G. Kirubavathi, and Iqbal H. Sarker. “DistilXIDS: Efficient, Lightweight and Explainable Transformer-Based Language Model for Real-Time Network Intrusion Detection”. In: Neurocomputing 668 (Mar. 2026), p. 132398. ISSN: 09252312. DOI: 10.1016/j.neucom.2025.132398. URL: https://linkinghub.elsevier.com/retrieve/pii/S092523122503070X (visited on 03/17/2026)
. [16] G Ananya et al. “Explainable AI for Enhanced Intrusion Detection Systems”. In: 2024 3rd International Conference for Advancement in Technology (ICONAT). 2024 3rd International Conference for Advancement in Technology (ICONAT). GOA, India: IEEE, Sept. 6, 2024, pp. 1–6. ISBN: 979-8-3503-5415-7 979-8-3503-5417-1. DOI: 10.1109/ICONAT61936.2024.10774733. URL: https://ieeexplore.ieee.org/document/10774733/ (visited on 03/17/2026).
[17] Reem Alshamy and Muhammet Ali Akcayol. “Intrusion Detection Model Using Machine Learning Algorithms on NSL-KDD Dataset”. In: International journal of Computer Networks & Communications 16.6 (Nov. 28, 2024), pp. 75-78. ISSN: 09752293. DOI: 10.5121/ijcnc.2024.16605
[18] Harikha Manthena et al. “Explainable Artificial Intelligence (XAI) for Malware Analysis: A Survey of Techniques, Applications, and Open Challenges”. In: IEEE Access 13 (2025), pp. 61611–61640. ISSN: 2169-3536. DOI: 10.1109/ACCESS.2025.3555926. URL: https://ieeexplore.ieee.org/document/10944807/ (visited on 03/17/2026).
[19] Yinghui Huang et al. “Decoding LLMs’ Verbal Deception in Online Reviews”. In: Decision Support Systems 200 (Jan. 2026), p. 114529. ISSN: 01679236. DOI: 10.1016/j.dss.2025.114529. URL: https://linkinghub.elsevier.com/retrieve/pii/S0167923625001307 (visited on 03/17/2026).
[20] Aneela Zameer et al. “A Survey on Recent Recurrent Neural Networks Based Intrusion Detection Systems”. In: Applied Soft Computing 192 (Apr. 2026), p. 114761. ISSN: 15684946. DOI: 10.1016/j.asoc.2026.114761. URL: https://linkinghub.elsevier.com/retrieve/pii/S1568494626002097 (visited on 03/17/2026).
[21] Nirjhor Anjum and Md Rubel Chowdhury. “International Journal of Advanced Research in Computer and Communication Engineering”. In: SSRN Electronic Journal (2024). ISSN: 1556-5068. DOI: 10.2139/ssrn.4847308. URL: https://www.ssrn.com/abstract=4847308 (visited on 03/19/2026).
[22] Nouman Ahmad and Changsheng Zhang. “Interpretable Vulnerability Detection in LLMs: A BERTBased Approach with SHAP Explanations”. In: Computers, Materials & Continua 85.2 (2025), pp. 3321–3334. ISSN: 1546-2226. DOI: 10.32604/cmc.2025.067044. URL: https://www.techscience.com/cmc/v85n2/63809 (visited on 03/17/2026).
[23] Mehwish Naz et al. “Meta-Ensemble Learning for Heart Disease Prediction: A Stacking-Based Approach With Explainable AI”. In: IEEE Access 13 (2025), pp. 137271–137290. ISSN: 2169-3536. DOI: 10.1109/ACCESS.2025.3588683. URL: https://ieeexplore.ieee.org/document/11079583/ (visited on 03/17/2026).
[24] Sarker, Iqbal H., et al. “Intrudtree: a machine learning based cyber security intrusion detection model.” Symmetry 12.5 (2020): 754. DOI: 10.3390/sym12050754. URL: https://www.mdpi.com/2073-8994/12/5/754
[25] Sankalp Kadam, Vinaya Gohokar, and Rupali Kute. “Machine Learning and Explainable AI for Thai Basil Growth Prediction in Hydroponics”. In: IEEE Access 13 (2025), pp. 99479–99489. ISSN: 2169-3536. DOI: 10.1109/ACCESS.2025.3576440. URL: https://ieeexplore.ieee.org/document/11023527/ (visited on 03/17/2026).


