
IJCNC 06
ANALYSIS AND VISUALIZATION OF CLOUD NATIVE
ATTACKS IN A SECURE TESTBED
Subbulakshmi T1 , Adithyan P2 , Sidharth M3 , Arun Santhosh R A4
1,2,3,4 School of Computer Science and Engineering, Vellore Institute of Technology Chennai
Abstract
Cloud computing has revolutionized modern-day digital infrastructure for large-scale application deployments. However its widespread adoption has brought in significant cybersecurity vulnerabilities also which also pose new and emerging threats to native cloud environments.Although there are many attack detection models, their suitability and stability are weakening day by day due to the lack of cloud-native or newer datasets which are designed to contain newer attack data. Our cloud native attack dataset sets a new standard towards a dataset including 22 of the most common attacks faced by cloud servers and instances. A visual analysis of those attacks is generated to provide a visual difference between the behavior of the various attack types by classifying them into clusters based on the nature of attacks and through usage data of various parameters such as port usage and protocol usage. In this paper we have designed a cloud-native dataset creation model generated with controlled cloud instances to adopt a cloudnative approach and the visualization of the generated attacks. Hence, this cloud-native attack dataset can surely be helpful to the research community in validating and training their new models.
Keywords
Cloud-native security, attack dataset, network intrusion detection, protocol exploitation, AWS, Cybersecurity
1. INTRODUCTION
Cloud native computing is the power source of the present scalable, flexible digital services employing containers, microservices, and automated cloud orchestration using well – designed tools and software. However, this dynamic architecture introduces vulnerabilities at various levels. Unlike traditional dataset which are focused on volumetric or legacy attacks, cloud native environments exhibit unique behaviors, and protocol features that attackers exploit to bypass perimeter defense, Modern attacks manipulate packet flags, timing, window size and checksum or leverage cloud specific capabilities to evade detection. Cloud-native computing is building an architecture or microservices for experimenting with the necessary services. The present research explores the possibilities of creation of an experimental testbed for exploring the network behavior of attacks.
The datasets available for cloud-native computing are scarce for the present applications. Since the datasets are limited, challenges such as exploring advanced detection techniques, Model degradation over time, failing to generalize to newer threat patterns are common issues to be resolved. This research work fills the gap by generating a cloud native dataset generation and categorization model using AWS EC2 (Amazon Web Services Elastic Compute Cloud) instances. The generated dataset supports both academic research and industry applications enabling the development of new frameworks and tools for attack detection. Educators may also use it for hands-on teaching of network forensic and secure-by-design products.
The DARPA dataset, initially published in 1998 by the U.S. Defense Advanced Research Projects Agency, is among the oldest benchmark datasets for testing intrusion detection systems; it features simulated network traffic with labeled attacks such as DoS, probing, and user-to-root exploits, but its age and synthetic nature make it less relevant for contemporary cloud and encrypted contexts. In comparison, the KDD Cup ’99 data set, which is based on DARPA’s 1998 traffic, classifies more than 4 million records into 23 types of attacks and normal traffic, offering features such as protocol, service, and flag data though commonly used to conduct machine learning studies, it has issues with redundancy and old attack patterns, leading to the creation of newer, cloud-born data sets.
2. LITERATURE SURVEY
The availability and development of DDoS attack datasets have been an influential part of cybersecurity research and especially in the context of cloud-native infrastructures. One of the pioneer contributions was proposed by the Canadian Institute of cybersecurity which was the CIC-DDoS2019 dataset. This dataset included 88 attack experiments emulation on cloud platforms such as AWS and Microsoft Azure for a wide variety of the modern DDoS attack vectors such as Port Map, LDAP, MSSQL, and UPD- Lag Attacks[1]. This diversity and realtime nature of the attacks have made the dataset be a cornerstone reference for subsequent benchmarking in intrusion detection research
To overcome the deficiencies of prior benchmarks, The BCCC-cPacket-Cloud_DDoS-2024 dataset was developed with great care through a comprehensive analysis of 16 publicly available datasets[2]. The dataset includes 17 DDoS attacks with eight benign user activity, producing a dataset with 26 labelled categories and over 300 traffic featured which makes it a strong base for fine-grained model training and evaluation, Similarly the Bot-IoT dataset created by UNSW Canberra’s Cyber Range Lab being one of the most comprehensive IoT-specific benchmark with more than 72 million records containing DDos, Dos, OS and service scanning and keylogging. It has established itself as a foundational resource for further development and botnet security research [3]
In parallel, more specialized datasets have been created targeting protocol-specific vulnerabilities: The TCP-SYN SDN dataset was designed on a controlled testbed using Mininet, which was combined with the captures of Wireshark to yield 6233 flow entries with 84 detailed features to study TCP-SYN flood attacks [4]. Expanding toward modern infrastructures, the Kubernetes-based testbed dataset (2024, arXiv) leveraged container, eBPF, and XDP technologies for generating scalable, cloud-native traffic datasets with strong ground truth, thus overcoming the static nature of previously available datasets [5].
This also led to the generation of a dataset modeling complex and simultaneous attack behaviors. For example, in 2022, Putra et al. presented parallel captures of botnet activities in the Botnet Dataset with Simultaneous Attack Activity, which enabled the analysis of simultaneous attackdefense dynamics for IoT and cloud environments [6]. More recently, works like the one on PCA-based feature selection for DDoS detection (Nature Scientific Reports, 2025) have proposed novel detection methodologies and introduced updated samples of datasets concerning current attack traffic trends [7].
Apart from these popularly referred datasets, a few domain-specific efforts are worth mentioning. The IoT-based Kaggle dataset, recently updated in 2024, focuses on botnet-generated DDoS traffic in cloud-connected devices [8]. Open source contributions like chiragbirdar’s SDN-based DDoS are developed with scripts and workflows for Mininet and Ryu controller environments[9] so that it would be modular and reproducible. Similarly dynamically reproducible state-of-the-art test beds like traffic generators using Kubernetes and eBPF/XDP[9] are emerging which use a modular dataset pipeline to achieve this reproducibility
Recent contributions have extended their focus from datasets to defense and evaluation methodologies. Such as works on holistic DDoS attack prevention in virtual cloud environment[10] and integrated dataset perspectives that combine multiple benchmarks for cloud security evaluations [10] address the bias and incompleteness brought by relying on a single dataset.A new shift towards cloud-provider-specific and microservice-oriented evaluations have been emerging with works such as AWS threat simulation using Stratus Red Team[11] and CBDS Dataset for microservice intrusion detection[13]
Customized datasets have been created for emerging domains such as server less computing notably, the DoW (Denial of Wallet) attack dataset for server less systems showcases some of e the unique attack vectors [13]. Complementary to this, Attack and defense dynamics at multiple layers of cloud-native stacks have been explored by static-analysis-based solutions for cloudnative security [14] and full stack vulnerability analysis [15]. Finally the Cloud Attack Dataset for Machine Learning and Deep Learning models [16],[17] consolidates the efforts towards the AI-ready benchmarks and general-purpose highlighting the convergence of data engineering, machine learning and security research
In general, the development route of the DDoS dataset has gone from static to dynamic and from single-domain benchmark to multiple-scenario and cloud-native benchmarks. While the CICDDoS2019 and Bot-IoT have been the foundation, recent efforts aim at realism, scalability, and modularity regarding the vast threat landscape of cloud, IoT, and server-less infrastructures. However, ensuring the generalizability, representativeness of evolving attack vectors, and standardization in datasets for a fair comparison remains a considerable challenge. These gaps continue to motivate the community toward next-generation, adaptive datasets that are both technically robust and operationally relevant
Complementary research has explored the practical application of machine learning models for real-time threat detection within cloud environments. The dataset to evaluate the performance of various machine learning algorithms [18]. Their analysis’s measured metrics including accuracy, precision, and detection time, demonstrated the effectiveness of classifiers such as Random Forest and Decision Tree in identifying malicious traffic patterns. Specifically, the study shows the Decision Tree Classifier as the most practical model in real-time for intrusion detection in AWS, due to its combination of high accuracy and superior processing speed. This emphasis on optimizing ML-based Intrusion Detection Systems (IDS) using existing, older datasets further underscores the need, as addressed by the present work, for new, highly representative cloudnative datasets to train and validate modern detection models against evolving threat landscapes. The addressing of class imbalance problems in intrusion detection systems by proposing a Weighted Extreme Learning Machine (WELM) model[19]. Using stratified sampling and costsensitive learning on dataset, their approach improved minority attack detection and reduced bias toward normal traffic, demonstrating the effectiveness of weighted learning for IDS performance enhancement.
3. PROPOSED SECURE CLOUD TEST BED ARCHITECTURE FOR ATTACK DATASET GENERATION
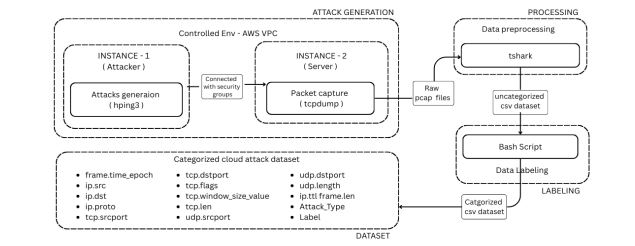
Figure 1. Proposed Architecture for the Dataset Generation
The proposed architecture follows a three-stage approach mentionedin Figure 1, which ensures that all the attacks are generated in a systematic and controlled environment, followed by the processing and extraction of necessary features from the generated traffic. The three phases of the generation are listed below
- Controlled Cloud testbed Setup
- Attack Dataset Generation and Capture
- Data Processing, feature extraction and Labelling
- Visualization of attacks
Algorithm
Pseudocode: CloudAttackDatasetGenerationAndVisualization
Time Complexity: O(A * m)
Where A is the total count of distinct attack runs in the loop and mis the average size (in packets) of each capture file that tshark and the labeling script process
Function CloudAttackDatasetGenerationAndVisualization(AWS_Account, hping3_Tool, tcpdump_Tool, tshark_Tool, Bash_Environment): // Output: Attack Dataset (CSV), Visualizations
// 1. Setup Cloud Testbed Attacker_EC2 = Create_EC2_Instance() // Instance 1 Target_EC2 = Create_EC2_Instance() // Instance 2 Configure_VPC_for_Private_Communication(Attacker_EC2, Target_EC2) Install_Software(Attacker_EC2, hping3_Tool) Install_Software(Target_EC2, tcpdump_Tool)
// 2. Simulate Attacks and Capture Data For Each Attack_TypeIn Predefined_22_Attacks: On Target_EC2: Start_tcpdump_Capture(PCAP_File) On Attacker_EC2: Execute_hping3_Command(Attack_Type) Wait(Predetermined_Duration)
On Target_EC2: Stop_tcpdump_Capture(PCAP_File) Save_PCAP_File(PCAP_File) // Assume saving to a central location or accessible storage
// 3. Process Captured Data For Each PCAP_File: Temp_CSV = Use_tshark_to_Extract_Features(PCAP_File, 15_Features) Temp_CSV = Use_Bash_Script_to_Label_Data(Temp_CSV, “Attack Type”, “Label”) Consolidate_Data(Comprehensive_CSV_Dataset, Temp_CSV)
// 4. Visualize Attacks Categorize_Attacks(Predefined_22_Attacks, 6_Behavioral_Clusters) For Each Cluster: Generate_Visualization(Cluster, “Packet_Rates_Over_Time”) Generate_StackedBarChart(“Protocol_Usage_by_Attack_Type”) Produce_BoxAndWhiskerPlot(“IP_TTL_Distribution_by_Attack_Type”) Generate_StackedBarChart(“Top_20_Ports_Packet_Count_by_Attack_Type”)
// 5. Present Results Display_Dataset_Statistics(Comprehensive_CSV_Dataset, Table_4) Present_Behavioral_Analysis_and_Visualizations(Figures_5_to_13) End Function
3.1. Controlled Cloud Test bed Setup
A dual Instance configuration is set up using AWS Elastic Compute Cloud (EC2) instances. Then these two instances were interconnected using AWS Virtual private cloud which ensures a private network connection between the two instances and prevents interruption to and from the outside public network, this setup provides cloud-native content while maintaining experimental control. INSTANCE 1 serves as the attacker machine which makes the attack using hping3 combined with various parameters. INSTANCE 2 acts as a server which is under attacks, this instance runs real-time packet capture software running in the background such that all the incoming packets are captured as mentioned in Fig. 1.
3.2. Attack Dataset Generation and Capture
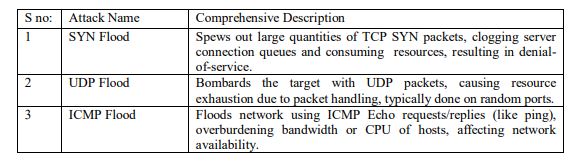
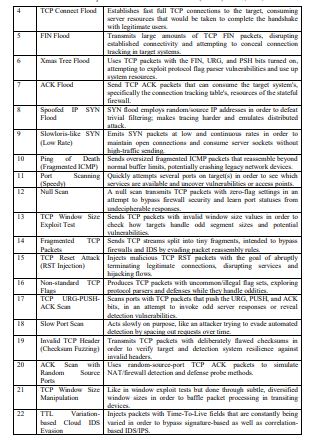
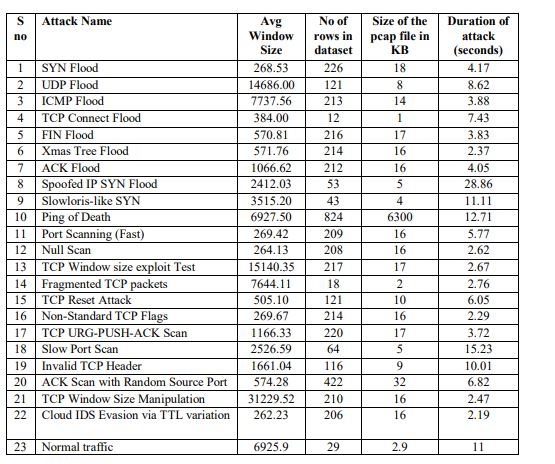
A total of 22 attacks were developed into the proposed dataset. This dataset includes traditional floods (SYN, UDP, ICMP) and sophisticated evasion techniques (TTL variation, Window size manipulation, Checksum fuzzing) given in Table 1. From the initial 22 attack types, all were selected for inclusion based on their ability to provide all of the required header-level features which were extracted during pre-processing.
Table 1 . List of all attacks which were simulated for the generation of the datase
Utilization of hping3[20] combined with various parameters given in Figure 2 helped in generating protocol and parameter-level control for attack generation providing precise control over packet categorization including flags, window size, TTL values and timing parameters.
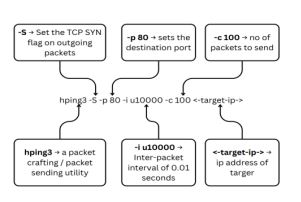
Figure 2. Diagram of the usage of hping3 tool

Figure 3. Diagram of the usage of tcpdump tool
Hence generated traffic was therefore captured in real time with tcpdumpas shown in Figure 3, a widely used command-line network packet analyser. This tool was used with root-level access on our instances allowing it to intercept, capture and log all the incoming and outgoing network attacks The tool was running in INSTANCE-2 (EC2), the machine being attacked by the other instance, which generated a comprehensive PCAP file containing both attack and benign traffic.
3.3. Data Processing, Feature Extraction and Labelling
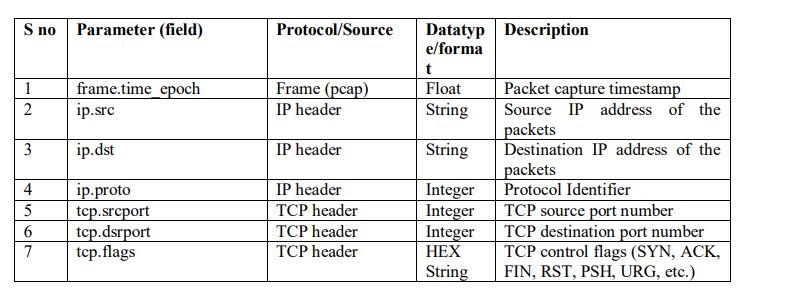
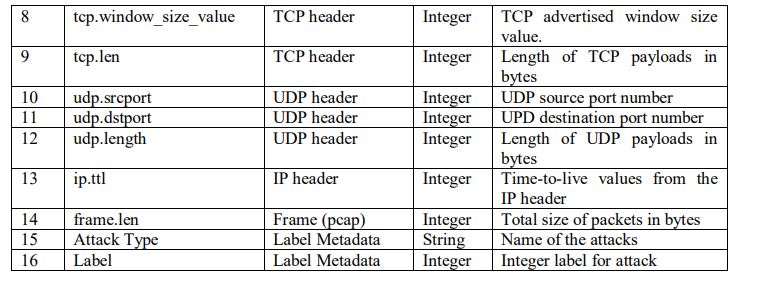
Automated and systematic raw pcap processing was executed using tshark as shown in Figure 4, extracting 15 selected features given in Table 2These consisted of TCP,UDP and ICMP characteristics, including protocol-specific fields such as flags, window size, port information and timing data. Thus generated data was uncategorized, but was then categorized and labelled using a custom bash script.
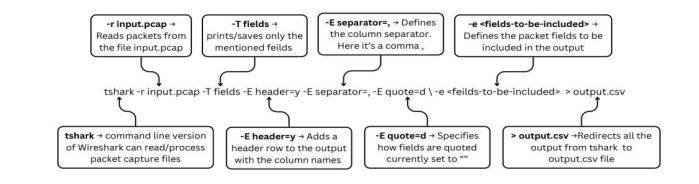
Figure 4. Diagram explaining the usage of tshark for converting pcap to csv
Table. 2. Dataset attributes/p>
4. RESULTS AND VISUALIZATION OF GENERATED ATTACK TRAFFIC
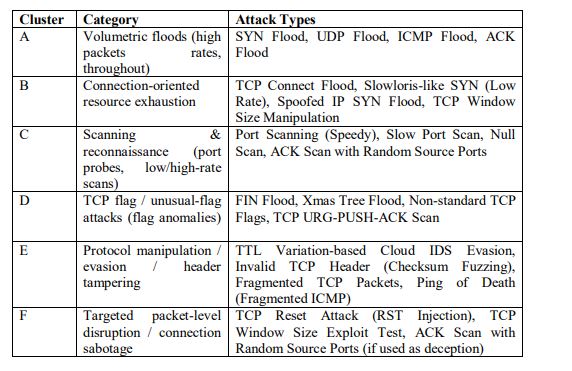
The categorization of generated traffic into six clusters provides us with a comprehensive way for understanding how different attack types manifest at a packet level given in Table 3. All the 22 cloud-native attacks were classified into 6 clusters based on a mix of quantitative features (packet rate, size distribution, TTL variance) and qualitative protocol semantics (flags used, header manipulation, session disruption). This makes the grouping both meaningful and technically reproducible
The categorization of generated traffic into six clusters provides us with a comprehensive way for understanding how different attack types manifest at a packet level. All the 22 cloud native attacks were classified into 6 clusters based on a mix of quantitative features (packet rate, size distribution, TTL variance) and quantitative protocol semantics (flags used, header manipulation, session disruption). This makes the grouping both meaningful and technically reproducible
Table. 3..Categorization Of Cloud-Native Attacks Into Behavioral Cluster
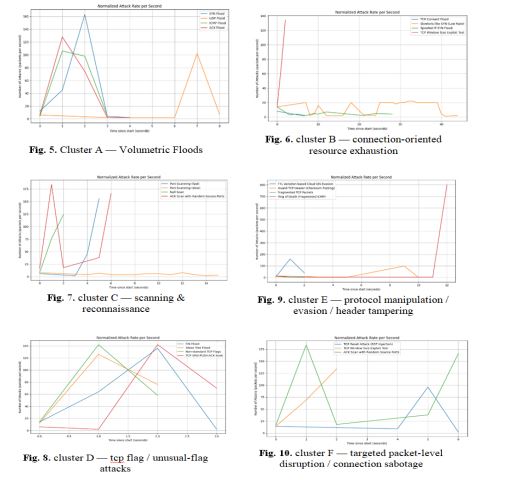
4.1. Behavioural Analysis of Volumetric floods
SYN, ICMP and ACK exhibit rapid ramp-up phases, reaching their respective peak rates between one and two seconds, followed by a precipitous drop to near-zero This shows the the shortduration high-intensity attack bursts while UDP follows a consistent low baseline until a pronounced spike shown in Figure 5 , distinguishing it as a delayed-burst attack with periodic escalation rather than an immediate surge.
4.2. Behavioural Analysis of Connection-oriented resource exhaustion
TCP Window Size Exploit triggers a sharp, high spike instantly, indicating a rapid, short-lived exploit. In contrast, TCP Connect Flood and Spoofed IP SYN Flood show gradually decreasing rates, reflecting brief but less intense resource use. The Slowloris-like SYN attack maintains a low, fluctuating rate for an extended period, exploiting server connection limits through persistent, low-rate requests. These patterns highlight that TCP Window Size Exploit is an acute, high-impact event, Slowloris-like is a stealthy, long-duration attack, and the others occupy an intermediate, short-burst exploitation profile shown in Figure 6.
4.3. Behavioural Analysis of Scanning & reconnaissance type attacks
Fast port scanning and ACK scans with random source ports produce sharp, high spikes that can indicate aggressive, bursty activity; null scans ramp up and peak quickly before stopping. Slow port scanning produces a low rate consistently throughout, reflecting stealthy, prolonged reconnaissance. Thus, fast and ACK scans are easily detectable due to high-rate bursts, null scans are short-lived but intense, and slow scans aim to evade detection by spreading packets over time shown in Figure 7.
4.4. Behavioral Analysis of TCP flag / unusual-flag attacks
The graph shows FIN, Xmas Tree, and Non-standard TCP Flags attacks peaking rapidly and declining, suggesting brief, intense floods, while TCP URG-PUSH-ACK Scan starts slower, peaks later, and sustains a higher rate longer, reflecting more persistent probing shown in Figure 8.
4.5. Behavioral Analysis of Protocol manipulation/evasion/header tampering type attacks
TTL Variation evasion spikes early to bypass IDS, Invalid TCP Header rises steadily via malformed packets, Fragmented TCP stays consistently low as slow evasion, and Ping of Death is silent until a sudden, massive late spike shown in Figure 9, overwhelming targets with fragmented ICMP bursts and causing potential system failure.
4.6. Behavioral Analysis of Targeted packet-level disruption / Connection Sabotage
ACK Scan with Random Source Ports surges early and late, reflecting bursts aimed at confusing state tracking, TCP Window Size Exploit builds linearly to a mid-test peak for resource exhaustion, and TCP Reset Attack remains mostly flat before spiking, indicating sudden, disruptive session termination shown in Figure 10.
4.7. Behavioural Analysis of Protocol Usage of Attacks
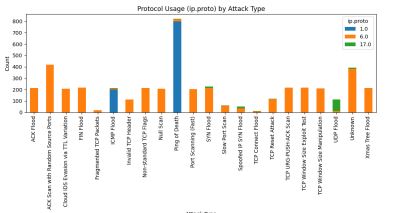
Figure 11. Protocol usage (ip.proto) by attack type
This graph shows the number of packets per second per protocol (ip.proto) for each of the 22 attacks generated shown in Figure 11]. The x-axis names each attack, while the y-axis represents the number of packets. Colored bars stack to indicate which protocol was used (Blue(1.0) for ICMP, orange (6.0) for TCP and green (17.0) for UDP). For each attack, the color mix of the bar shows whether the attack predominantly uses one protocol-e.g., all orange for TCP attacks-or has a mix of protocols. Attack types, including “Ping of Death”, have large numbers of blue bars representing ICMP packets, while attacks such as “UDP Flood” feature prominently green bars. Differentiating attacks based on this protocol distribution is straightforward. Attacks focused on a single protocol are easy to spot: SYN Floods, Xmas Tree Floods, and most scan attacks are dominated by TCP (orange bars); ICMP Floods and Ping of Death uniquely use ICMP (blue bars); UDP Flood relies solely on UDP (green bars). If a stacked attack has significant counts across multiple protocols, this signals multi-vector attacks or protocols. Thus, by observing which protocol(s) account for the highest volume within each attack type. One can accurately identify the fundamental nature of the attack—whether it exploits transport mechanisms (TCP/UDP), network-layer messaging (ICMP), or combines several for broader effects.
4.8. Behavioural Analysis of IP / TTL Distribution Of Attacks
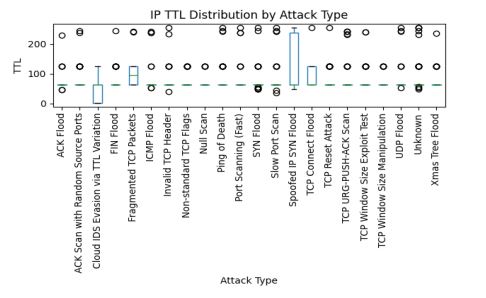
Figure 12. IP TTL distribution by attack typ
The values shown in the graph represent the distribution of IP Time To Live (TTL) values of each attack type which is then visualized as a box-and-whisker plot where the y-axis is TTL and the x-axis lists the various attacks which were simulated shown in Figure 12. For each of the 22 generated attacks the plot provides a summary of how TTL values vary across observed packets. The box captures the interquartile range (middle 50% of TTLs), the line inside the box marks the median TTL, whiskers reflect typical spread, and the outlier circle shows unusually high or low TTL points outside the main distribution. The dashed horizontal line indicates the overall median TTL observed across all the attack types, helping quickly compare whether specific attacks deviate from the norm.
Differentiating between attacks via graph relies on interpreting these TTL patterns and variance, Attacks with tight, consistent TTL distributions (narrow box, few outlier points) usually come from hosts with similar OS defaults or a closely coordinated botnet, suggesting targeting SYN floods or scans from a single attacker. By contrast, attacks which show a wide TTL spread, cluster or lots of outliers (wide boxes, many distinct median values or highly variable outliers) may indicate distributed sources, spoofing, or deliberate TTL randomizations to evade detection typical of spoofed SYN flood attacks or evasion-focused attacks. For example, a spoofed IP
SYN flood attack will display diverse TTLs (due to many origins or artificially altered TTLs), whereas a classic SYN flood from a homogeneous botnet is marked by a single dominant TTL. “Cloud IDS Evasion via TTL Variation” will specifically show large scatter and a diffuse TTL profile. Careful analysis of these patterns—combined with port, protocol, length, and flag features from each packet—enables reliable, repeatable attack labeling and deep network forensic insights
4.9. Behavioural Analysis of IP / TTL distribution of attacks
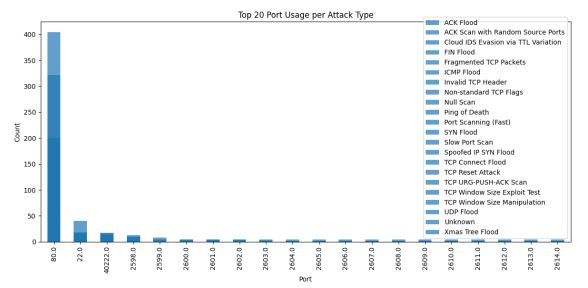
Figure 13. No of packets received in top 20 ports for different types of attack
The values in this graph represent the count of network packets per destination port for the top 20 most-used ports, split across different attack types shown in Figure 13. The x-axis lists the port numbers (such as 80, 22, 40222, etc.) while the y-axis shows how many packets targeted each port. Each of these vertical bars is color-stacked, showing which type of attack contributed to which port; there is a legend matching the attack type with colors. The count for Port 80, used typically for HTTP, is the highest, indicating it’s the prime target of the attacks in this dataset, followed by ports like 22 for SSH and others that are far less prominent.
Attack differentiation based on port usage focuses on patterns within these distributions. Attacks concentrated on a single port example, huge traffic spikes toward port 80-indicate targeted application-layer DDoS or floods, such as SYN Flood or ACK Flood against a web server. If several attack types, distinguished by bar color segments, focus on one port, it likely means that port is a common vulnerability or service-under-test. In contrast, scanning attacks will distribute traffic across many ports without the predominance of any one port, and so the chart would show more horizontal spread with lower counts per port. Such a dispersed pattern should be exhibited in attacks like “Port Scanning (Fast)” and “Slow Port Scan.” TCP-based exploitation or manipulation attacks may concentrate on ephemeral or uncommon ports, indicating attempts to bypass standard firewalls or probe non-standard services. By associating a distinct attack type with repeated heavy traffic to a port, or a widespread one, one could robustly infer whether the behavior is a targeted flood, a scan, or a sophisticated multi-port distributed attack.
4.10. Applications
The resulting dataset offers great utility for research and industry. From an academic perspective to design and test more advanced intrusion detection algorithms with a focus on attack patterns of cloud-native attacks. For practitioners, the dataset can be used to enhance intrusion detection systems, SEIM platforms, and CSPM tools, particularly for the security of containerized and
dynamic cloud environments. Network administration can benefit from its potential to extend content-sensitive threat detection within cloud infrastructures like AWS. Additionally the dataset’s emphasis on visualization of diverse attack scenarios makes it well-suited for building models that can detect subtle, real-time threats overlooked by traditional signature-based systems
5. THE STATISTICS OF THE RESEARCH DATASET
Table. 4. Attack Statistics
6. CONCLUSION
This work introduces cloud native attack dataset that consolidates 22 high impact protocol-level threats from volumetric ones like SYN, UDP, and ICMP floods to stealthy evasions such as TTL variation and checksum fuzzing – captured entirely inside a controlled AWS VPC. Leveraging an automating pipeline that couples hping3 traffic generation with tcpdump/tshark extraction and Bash driven labelling, the framework yields a compact 15-feature dataset. Along with a visual representation of those generated attacks in multiple contexts such as the packets per attacks per second to indicate how different attacks spoofs, evades or attack undetected to the server and protocol usage distribution which provides a visualization of the protocol types used by attacks such to make it clear how some attacks type becomes undetected by using more than one or more protocol types, Port usage distribution which visualizes how much attacks rely on single port or multiple ports for attacking Such visual distribution graphs and packets per second distribution makes it easy to understand how each attack differs from each other.
7. CONFLICTS OF INTEREST
The authors declare no conflict of interest.
REFERENCES
[1] Canadian Institute for Cybersecurity, CIC-DDoS2019: DDoS Evaluation Dataset, University of New Brunswick, Fredericton, Canada, 2019.
[2] York University, BCCC-cPacket-Cloud-DDoS-2024 Dataset, BCCC Research Blog, Toronto, Canada, 2024.
[3] UNSW Canberra Cyber, The BoT-IoT Dataset, University of New South Wales, Canberra, Australia, 2019.
[4] S. Kumar and S. Gupta, “SDN TCP-SYN dataset: A dataset for TCP-SYN flood DDoS attack detection in software-defined networks,” Data in Brief, vol. 59, p. 111314, 2025.
[5] T. Farasat, J. Kim, and J. Posegga, “Advancing network security: A comprehensive testbed and dataset for machine learning-based intrusion detection,” arXiv preprint, 2024.
[6] M. A. R. Putra, D. P. Hostiadi, and T. Ahmad, “Botnet dataset with simultaneous attack activity,” Data in Brief, vol. 45, p. 108628, 2022.
[7] S. Abiramasundari and V. Ramaswamy, “Distributed denial-of-service (DDoS) attack detection using supervised machine learning algorithms,” Scientific Reports, vol. 15, p. 13098, 2025.
[8] Siddharthm1698, DDoS Botnet Attack on IoT Devices, Kaggle Dataset, 2020.
[9] T. Farasat, J. Kim, and J. Posegga, “Advancing network security: A comprehensive testbed and dataset for machine learning-based intrusion detection,” arXiv preprint, 2024.
[10] “Prevention and detection of DDoS attack in virtual cloud computing,” ScienceDirect, 2023.
[11] “Merging neural networks with Spark for cloud security,” ScienceDirect, 2025.
[13] “Evaluating intrusion detection for microservice applications,” ScienceDirect, 2024.
[14] “Generation of a dataset for DoW attack detection in serverless environments,” ScienceDirect, 2023.
[15] “Static-analysis-based solutions to security challenges in cloud computing,” PubMed Central (PMC), 2023.
[16] “Full-stack vulnerability analysis of the cloud-native platform,” ScienceDirect, 2023.
[17] “Cloud attack dataset for building machine learning and deep learning models,” Mendeley Data, 2023.
[18] “Intrusion detection in AWS cloud environments using machine learning on network flow data,” International Journal of Advance Research, Ideas and Innovations in Technology (IJARIIT), vol. 11, no. 5, 2023.
[19] M. Awad and A. Alabdallah, “Addressing imbalanced classes problem of intrusion detection system using weighted extreme learning machine,” International Journal of Computer Networks & Communications, vol. 11, no. 5, pp. 39–58, Sep. 2019.
AUTHORS
Dr. T. Subbulakshmi is a Professor at VIT Chennai with a strong research orientation in computer science and cybersecurity. She has published in reputed IEEE conferences and journals, with key contributions in areas such as network security, cyber forensics, and secure system design, while actively mentoring students and promoting high-quality research.
Adithyan P is a student in the School of Computer Science and Engineering at VIT Chennai, pursuing studies in computing with interests in cybersecurity, artificial intelligence, software engineering, DevOps, and the development of autonomous tools using AI and machine learning.
Sidharth M is a cybersecurity researcher pursuing a B.Tech in Computer Science and Engineering, specializing in Cybersecurity at Vellore Institute of Technology Chennai. He focuses on penetration testing, network security, threat analysis, and system-level security. His work extends to security automation, DevOps-integrated security practices, and the development of intelligent defensive mechanisms using machine learning, with broader interests in digital forensics.
Arun Santhosh R A comes from a Computer Science and Engineering background at Vellore Institute of Technology. His interests include cybersecurity, Zero Trust architectures, and modern DevOps practices. He focuses on integrating strong security principles into development and operational workflows to create secure, scalable, and efficient systems

