
IJCNC 04
An Energy Hole Detection and Relay Repositioning in Cluster Based Routing Protocol for Improving Lifetime of WSN
Saranya Selvaraj and Anitha Damodaran
Department of Computer Science, Sri Ramakrishna College of Arts and Science for
Women, Coimbatore- 641044, Tamil Nadu, India
ABSTRACT
Clustering is essential in Wireless Sensor Networks (WSNs) as it facilitates less energy consumption routing, network partitioning, and the optimization of routing pathways depending upon the parameters such as energy consumption and distance. Numerous Clustering Routing Algorithms (CRAs) have been formulated for a long time. Among them, a Relay-optimized Dual Mode energy-minimized SCA-Levy (RDMSCA-Levy)-based CRA can choose the optimal Relay Node (RN) in multi-hop WSNs to enhance inter- and intra-cluster transmission. However, the major limitation of the static node deployment in WSN is the possibility of energy holes’ formation, even with high residual energy. Therefore, this article proposes an Enhanced RDMSCA-Levy (ERDMSCA-Levy) algorithm for multi-hop WSNs to detect and prevent energy holes. It incorporates the Voronoi geometry-based hole detection and relay positioning model-based hole prevention approaches. In the hole detection phase, the network region is split into Voronoi cells, where each sensor node serves as a generating point in the geometry. Then, the distance between the sensor nodes within the Region of Interest (ROI) and the edge points of their corresponding Voronoi cells Is determined. Any abnormal distances are detected as potential holes in the network. After that, a relay-based hole prevention is introduced, which involves repositioning RNs within the network based on the energy and distance. The updated locations of these RNs are then integrated into the Deep Learning (DQL) algorithm to choose the best RN position and optimize the coverage. Finally, the findings reveal that the ERDMSCA-Levy attained a better efficiency when evaluated with the existing CRAs.
KEYWORDS
Multi-hop WSN, Clustering routing, RDMSCA-Levy, Energy hole, Voronoi cell, Node repositioning
1. INTRODUCTION
A common WSN consists of several tiny self-regulating sensor nodes that gather, interpret, and transfer information about a specific environment to the Base Station (BS) [1]. This system mainly employs clustering routing techniques for dividing the network into small groups and transferring information to the BS with a minimum energy depletion. The two most well-known clustering routing techniques in WSN include the distributed-based protocol (Low Energy Adaptive Clustering Hierarchical (LEACH)) and the centralized-based protocol (Centralized LEACH (LEACH-C)) [2]. Distributed protocols demand more energy, memory, and processing power than centralized ones, which can elect the best CH or route for every cycle. In the past decades, some researchers determined CHs first, while others created clusters first [3-4]. Additionally, to reduce excessive energy depletion, some academics have suggested the idea of determining dual CHs, such as primary and secondary.
In clustering routing techniques, the initial phase dynamically elects CHs by utilizing many criteria, including distance, BS position, remaining energy, clustering uniformity, and so on. The next phase transfers data via single-hop or multi-hop routing based on where the BS is located [5- 6]. Many academics haverecently been working on enhancing clustering routing techniques recently. They have presented new advanced algorithms for WSNs and enhanced upon earlier procedure samples by utilizing novel high-level heuristic optimization schemes [7-8]. Among many studies, Guo et al. [9] suggested the SCA-Levy mutation for The WSN clustering routing algorithm. Primarily, the CHs were determined by the SCA with a modified step size, while their global search ability and population diversity were enhanced by the Levy mutation. To guarantee lower inter-cluster transfer costs, a selection strategy was subsequently introduced that considers the spatial relationship between the BS and the monitoring zone. Furthermore, the optimal RNs were determined depending upon the node’s position and the BS’s residual energy, which shortened the communication range and extended longevity. However, because this strategy did not use delay as a fitness function, it may result in QoS problems when the network size increases, such as extended transmission range or excessive latency during intra- and inter cluster transmission.
To address these issues, the RDMSCA-Levy algorithm was developed [10], which describes the multi-hop RN selection problem as a Markov Decision Process (MDP) and resolves it by employing deep reinforcement learning. It adopted a distributed scheme with a corrected update function based on Deep Q-Learning (DQL). Once the CH was determined, Q-tables are trained by every cluster and best RNs are chosen according to the residual energy, BS separation, node density, and region covered. Moreover, it applied the dual-mode energy-efficient inter- and intra cluster transfer for forwarding information between the Source (S) and the BS. On the other hand, the major limitation of static node deployment in WSN is the possibility of energy holes’ formation, even with high residual energy. Existing solutions to prevent energy holes were centralized and effective for single-hop WSN. So, scalable and low-complexity solutions are needed for multi-hop WSNs.
1.1. Major Contributions
In this paper, the ERDMSCA-Levy algorithm is suggested for WSNs that use multiple hops to detect and prevent energy holes. This algorithm incorporates the Voronoi geometry-based hole detection and relay positioning model-based hole prevention approaches. In the hole detection phase, the network region is split into Voronoi cells, where each sensor node serves as a generating point in the geometry. Voronoi shapes are created by the sensor nodes as key points in the network. To guarantee full coverage of the target region, a few sensor nodes are strategically situated at the boundaries and junctions of the grid, allowing the Voronoi cells to cover the entire region. Based on this, the entire network area is split into a mesh of these Voronoi cells. Then, the hole region is determined by the distance between the opt sensor nodes within the ROI and the edge points of their corresponding Voronoi cells. This is achieved by relating the sensor nodes to the closest coordinate points on the cell’s boundary. Any abnormal distances in the ROI are detected as potential holes in the network. Once a hole region is identified, a relay-based hole prevention is performed, which involves repositioning RNs within the network. This positioning
of the RNs is computed by the Voronoi-based scheme, considering multiple criteria such as energy levels and distance. The updated locations of these RNs are then integrated into the DQL model to choose the best RN and optimize the coverage. Thus, it ensures that energy holes are detected and prevented to maintain network coverage efficiently.
The Below sections are structured as follows: The literature review is discussed in Section 2. Section 3 describes the ERDMSCA-Levy, while Section 4 evaluates it. Study details and recommendations for further research are included in Section 5.
2.RELEVANT WORKS
This section reviews some of the recent studies related to energy hole detection and prevention in WSNs. Sharmin et al. [11] presented a novel technique by partitioning the network into equiangular wedges and aggregating a wedge with its adjacent wedge adaptively if the remaining energy of each member node of a wedge was lower than a threshold value. Additionally, they introduced an efficient head node selection to decrease the transfer energy required to send data packets among head nodes. However, throughput and E2D were not analyzed.
Gulganwa & Jain [12] developed an Energy-Efficient and Secure Weighted Clustering Algorithm (EES-WCA). Initially, clusters were created, and data packets were transferred to the BS. The BS has a machine learning algorithm to categorize the received data and recognize the suspected nodes in the network. However, throughput was low, and mean energy usage was high. Lima et al. [13] presented a new location-free geographic routing method called Proactive Approach to Circumvent Holes (PAtCH) to prevent energy hole areas and form routing paths toward the target node in WSN. They considered that the sink has a greater transfer array, and the Received Signal Strength Indicator (RSSI) was utilized to create the path. However, throughput was low, and energy usage was high.
Shukla [14] presented Angle-Based Critical Node Detection (ABCND) for trustworthy industrial WSN. Initially, a 2D critical node identification scheme, which utilizes only the neighbor’s RSSI data. Then, a correlation-based reliable RSSI scheme was applied to improve the node’s flexibility over the opponent. However, throughput was low. Naderloo et al. [15] developed a Fuzzy-Based Clustering Routing (FBCR) algorithm, which selects CH using fuzzy input comprising network zone and node residual energy factors, node separation from the center of all zones, and node-to-BS angle. However, the mean residual energy and the number of alive nodes were low.
Wang et al. [16] developed a hybrid Fuzzy logic and Quantum Annealing algorithm (FQA)-based clustering and routing algorithm in WSNs. They utilized the fuzzy inference system to choose suitable CHs and the QA algorithm to choose the best path from the CH to the BS. However, energy usage was high, which can increase the number of dead nodes and create energy holes in the network. Karim et al. [17] developed an Enhanced Centroid-based Energy-Efficient Clustering (ECEEC) algorithm to improve energy efficiency in WSNs. However, energy usage was high, and throughput was low. Li et al. [18] created a routing technique for WSNs called Adaptive Energy-efficient Balanced Uneven Clustering (AEBUC). For best clustering, the competition radius was actively changed depending on node density and distance from the candidate CH to the BS. Adaptive CH selection was based on the energy relative density and the
candidate CH relative density in candidate CHs. An effective transmission routing tree for best inter-cluster multi-hop routing was produced by combining the relay transmission cost function developed during inter-cluster transfer with the minimal spanning tree approach. But, throughput was low due to the energy hole formation problem. From the above literature studies, it can be addressed that many clustering routing algorithms face problems with low throughput and high energy usage, signifying an imbalance between energy efficiency and network longevity. This can cause energy holes in the network and impact the QoS efficiency. So, the proposed algorithm can detect and prevent energy holes in WSNs for improving the routing performance.
3.PROPOSED METHODOLOGY
This part briefly describes the ERDMSCA-Levy method for multi-hop WSNs. A block diagram of this study is depicted in Figure 1. First, SCA-Levy technique is used for clustering and CH election. Then, energy hole detection and prevention is performed to identify and prevent holes by repositioning RNs. Furthermore, the dual-mode energy-efficient intra- and inter-cluster transmission is performed.

Figure 1. Schematic representation of the Suggested Research
3.1. Network & Channel Model
The paradigm of a multi-hop network, as described in [9], is the subject of this investigation. There are clusters of nodes depicted in the model, in addition to a source node and a destination node, also known as BS. There are decode-and-forward RNs in each cluster, denoted as, where. To keep things simple, let’s say that and are both equal to 1, and that stands for and for. Unless you count the nodes in, neither the RNs nor are in direct contact with. RNs selected from are part of the path that takes to send the signal to. starts the multi-hop communication by sending data to . Someone at is selected to receive the data and subsequently transmits it to . This procedure is carried out until transmits the data. The wireless channels suffer from the Rayleigh fading and the artifact at every receiver is a intricate additive white Gaussian random variable with 0 mean and 𝜎2 variance. The inter-cluster complex channel coefficients from 𝑅𝑘
′𝑛−1to 𝑅𝑘 𝑛 are denoted as ℎ𝑘 ′𝑘 𝑛 . If 𝑛 = 𝑁 + 1, then ℎ𝑘 ′𝑘 𝑁+1 = ℎ𝑘 ′𝐷 𝑀+1 . Assume the transmit power of 𝑅𝑘′ 𝑛−1 is 𝑃𝑛−1, the SNR of 𝑅𝑘 𝑛 is represented as:
𝛤𝑘 ′𝑘 𝑛 = 𝑃𝑛−1|ℎ 𝑘′𝑘𝑛 |2𝜎2, 𝑛 = 1, … , 𝑁 + 1
Additionally, End-to-End (E2E) signal-to-noise ratio (a SNR) for multi-hop transmission are described by,
𝛤𝐸 = min 𝑛 𝛤𝑘 ′𝑘 𝑛 , 𝑛 = 1, … , 𝑁 + 1
𝑅𝐸2𝐸 = 1 𝑁+1 log(1 + 𝛤𝐸)
3.2. Problem Goals and Definitions
Problem Goals: WSNs are often considered to have a dynamic and unpredictable atmosphere because of the arbitrary positioning of sensor nodes in the ROI. The energy depletion leads to isolated nodes and holes in the network. The major aim of this research is to precisely estimate the extent of these holes in the ROI, which is essential to assess the damaged region in the event of catastrophes, assisting the routing mechanisms to modify the routes and reposition the location of RNs in a suitable place to restore the holes.
The following definitions apply:𝑛 is the count of chosen nodes, 𝒞𝑖 is the count of ROI cells, 𝑃𝑖 is the count of ROI edge points in each ROI cell and𝑁𝐻𝑖 is the count of cells’ CH. In a ROI, 𝐴𝑖 represents a single produced triangle, 𝐴𝑗 the region of 𝐾 + 1 triangles created at one edge point, 𝐴𝑐𝑒𝑙𝑙 the region of overlaid holes in a single cell and𝐴𝑡𝑜𝑡𝑎𝑙 the region of overlaid holes in the ROI as a whole. (𝑋0, 𝑌0 ) = (0,0) is the set of all points with 𝑥 = 0 and 𝑦 = 0. The variables 𝐾, 𝑚, 𝑍𝑎 and 𝑍𝑏 represent the quantity of horizontal lines, number of vertical lines, cluster length and cluster width.
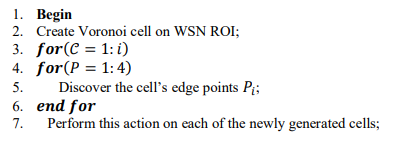
3.3. Suggested Algorithm for Identifying and Preventing Energy Holes
This section describes the suggested algorithm to identify and determine the hole region in the ROI. This algorithm utilizes Voronoi diagrams to partition the ROI into homogeneous regions by creating Voronoi cells around sensor nodes. These cells are adapted based on the locations of each sensor node. The energy hole detection algorithm operates within each Voronoi cell independently. It compares the points at which adjacent cells meet with the points at which nodes inside the same cell are located and then selects the maximum quantity of sensor nodes that are 𝑘 distance away from each cell’s boundary. Once the 𝑘 𝑡ℎ sensor nodes are chosen for a certain Voronoi cell, this algorithm opts for the sensor node closest to the centroid of the cell as the CH by using the SCA-Levy mutation. The CH can gather data from the other nodes within the cell and determine the hole regions using the triangulation scheme.
The proposed energy hole detection algorithm consists of the following steps:
- Voronoi cell creation & ROI partitioning
- Energy hole identification
- Energy hole healing
3.3.1. Voronoi Cell Creation & ROI Partitioning
Voronoi diagram is initially created for each static sensor node, considering that all nodes know their adjacent node’s coordinates. Here, a local Voronoi diagram is constructed using a localized building approach. Each node builds its Voronoi cell by thinking about the nodes that are one hop away. A local Voronoi diagram is first generated. The sensor field is then divided into subregions using Voronoi cells, with each static node contained within its own Voronoi cell. Sharing a Voronoi edge makes two nodes Voronoi neighbors.
A Voronoi diagram within a constrained sensor field is depicted in Figure 2.where the field’s borders are represented by Voronoi cells. In the diagram, each point is in proximity to exactly one node. Voronoi cells can have energy holes at their undiscovered spots. To avoid having any exposed points inside its Voronoi cell, a sensor must cover all of its vertices. Thus, in this step, the Voronoi cell creation is utilized to partition the ROI into several predefined static cells.

Figure 2. Example of Voronoi Diagram for Energy Hole Detection
3.3.2. Energy Hole Detection
This step identifies and determines the hole region in the ROI. The detection process operates on each cell independently. The energy hole detection approach determines the hole regions by selecting the 𝑛 𝑡ℎ sensor node that is geographically nearest to the cell’s coordinates, where selection is done by comparing the cell’s coordinates to all sensor nodes within it. Once enough quantity of sensor nodes is chosen, this approach takes the nearest sensor node to the cell’s coordinate, which satisfies the criteria provided in the SCA-Levy mutation, as a CH. Depending on the chosen routing protocol, this CH will first collect data from the opposite nodes and send it out in a cascade. Then, the CH determines the hole region by a triangulation scheme.
Consider 𝑃 represents a group of edge points of a cell, where 𝑃 ∈ 𝑃1, 𝑃2, … , 𝑃𝑖 . This approach relates the highest communication ranges of the 𝔫 selected sensor nodes with the location of edge points of all cells. For a sensor node to be considered to have no hole, its communication range must intersect with the edge of the Voronoi cell. If not, as shown in Figure 3, that cell will have a hole in it.
Once the hole is identified, this approach determines the hole region by using the triangulation scheme among the selected sensor nodes and the cell’s edge point. Straight lines are used to connect sensor nodes to the nearest cell coordinate point, forming triangles. The

Figure 3. Energy Hole in a Single Voronoi Cell
hole region in the Voronoi cell is determined by computing the area of triangles 𝐴1, 𝐴2, … , 𝐴𝔫+1 using the following equations:
𝐿1 = (𝑌1 − 𝑌0 − 𝑟)
𝐿𝔫+2 = (𝑋𝔫 − 𝑋0 − 𝑟)
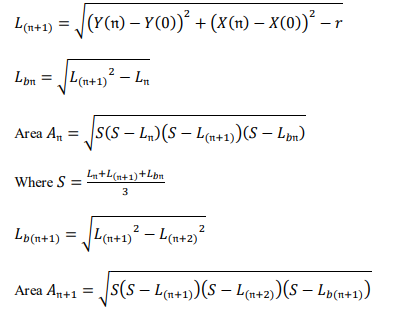
In above equations, 𝑟 is the radius of the sensor. Therefore, the region of the hole in certain cell (𝐴𝑗) is determined by totaling the quantity of the separate triangle area as follows:
𝐴𝑗 = ∑ 𝐴�
In Eq. (10), The area of the triangle i that is formed after cutting the hole into many triangles is represented by 𝐴𝑖 . By continuing this procedure of identifying hole regions from one cell to each of its four corners, this approach can find any hole region within the cell as follows:
𝐴𝑐𝑒𝑙𝑙 = ∑ 𝐴�
To determine the total hole region in ROI, by continuing this procedure on each cell in ROI, this approach can detect the total hole region in the ROI as follows:
𝐴𝑡𝑜𝑡𝑎𝑙 = ∑ 𝐴𝑐𝑒𝑙�
Thus, the energy hole detection approach uses the Voronoi diagram to identify and determine the energy hole region within the specified ROI. A representation of the procedure for this approach is shown in Figure 4.
Algorithm 1: Energy Hole Detection
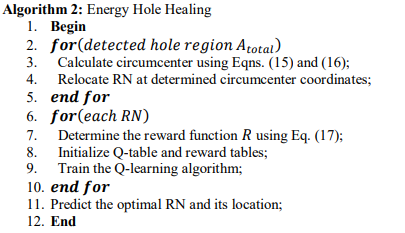
3.3.3. Energy Hole Healing
The determined hole regions in the network are restored in the energy hole healing phase by repositioning the RNs at the position of the circumcenters of triangles with a hole to optimize energy usage and network efficiency. The circumcenter coordinates of triangles formed by any three sensor nodes in a hole region 𝐴𝑡𝑜𝑡𝑎𝑙 is determined as follows:
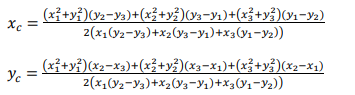
In Eqns. (15)-(16), (𝑥𝑐 , 𝑦𝑐 ) are the coordinates of circumcenters of triangle, (𝑥1, 𝑦1 ), (𝑥2, 𝑦2 ) and(𝑥3, 𝑦3 ) are x and y coordinates of three sensor nodes in the hole region. To find the optimal locations of RNs for appropriate repositioning, a Voronoi diagram is used with multiple criteria such as node density, coverage area and proximity to the BS. So, the network area is partitioned into Voronoi cells, where each RN is at the center of that cell. The partitioning is based on diverse parameters such as node density, coverage area and distance to the BS. This initial configuration guarantees that each RN serves a specific area with maximum efficiency in energy consumption and coverage. When the initial configuration is done, the network will be continuously evaluated based on energy consumption, distance to the BS and coverage efficiency. RNs will adjust their positions based on the reward function 𝑅 in Q-learning model [9], which is
defined as follows:
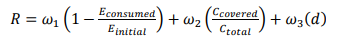
In Eq. (17), 𝜔1, 𝜔2, 𝜔3 are weight values, 𝐸𝑐𝑜𝑛𝑠𝑢𝑚𝑒𝑑 is the energy consumed, 𝐸𝑖𝑛𝑖𝑡𝑖𝑎𝑙 is the initial energy, 𝐶𝑐𝑜𝑣𝑒𝑟𝑒𝑑 is the coverage range of the RN’s Voronoi cell, 𝐶𝑡𝑜𝑡𝑎𝑙 is the total network area and𝑑 is the distance between RN and BS.
Dynamic repositioning is based on rewards from actions, such as successful data transmission while minimizing energy costs. As the network learns, the optimum position for each RN is

Figure 4. Flow Diagram of Energy Hole Detection Approach
Continually updated in a Q-table. The reward function evaluates the performance of the current RN positions. If the current position yields less energy consumption or good data transmission, then the RN remains in its position. Otherwise, the model proposes a new position that could potentially yield better performance. Over several iterations, the positions of the RNs are adjusted to ensure maximization of network performance by balancing energy efficiency, coverage, and reliable transmission. Thus, this repositioning approach ensures that RNs are optimally placed to reduce energy holes, enhance the network lifespan, and maintain efficient communication.
4.SIMULATION OUTCOMES
The performance of the ERDMSCA-Levy algorithm was assessed in comparison to established algorithms, including RDMSCA-Levy [10], FBCR [15], ECEEC [17] and AEBUC [18], within the context of multi-hop WSNs. The simulation analysis is performed utilizing Python 3.7 software. Table 1 presents the parameters and their corresponding values utilized to simulate both the traditional and suggested techniques for a fair comparison.

Table 1. Simulation Parameters
4.1. Throughput
It measures the number of effective data transmissions within a specified timeframe from nodes
to sink.
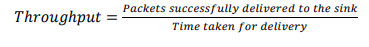

Figure 5. Total Transmitted Packets vs. Rounds
The throughput numbers linked to various CRAs are compared in Figure 5. For 1000 rounds, the ERDMSCA-Levy technique increases the throughput by 61.54%, 40%, 23.53%, and 11.7% higher than the FBCR, ECEEC, AEBUC and RDMSCA-Levy. It demonstrates that the ERDMSCA-Levy technique maximizes the total transferred information to the BS in comparison to the existing algorithms in multi-hop WSNs due to the identification and prevention of energy holes by repositioning the RNs.
4.2. Total Energy Usage for Relaying
The energy consumption of each sensor node is quantified as it receives data from the neighboring CH node and subsequently transmits it to the next CH or BS through the RN.
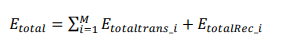
In Eq. (19), 𝑀 represents the total amount of nodes, 𝐸𝑡𝑜𝑡𝑎𝑙𝑡𝑟𝑎𝑛𝑠𝑖 indicates the total transfer energy utilized by node i and𝐸𝑡𝑜𝑡𝑎𝑙𝑅𝑒𝑐_𝑖 signifies the total energy expended by node i while obtaining information from neigh bouring nodes.

